
U.S. gasoline prices heading into Labor Day weekend are lower than last year
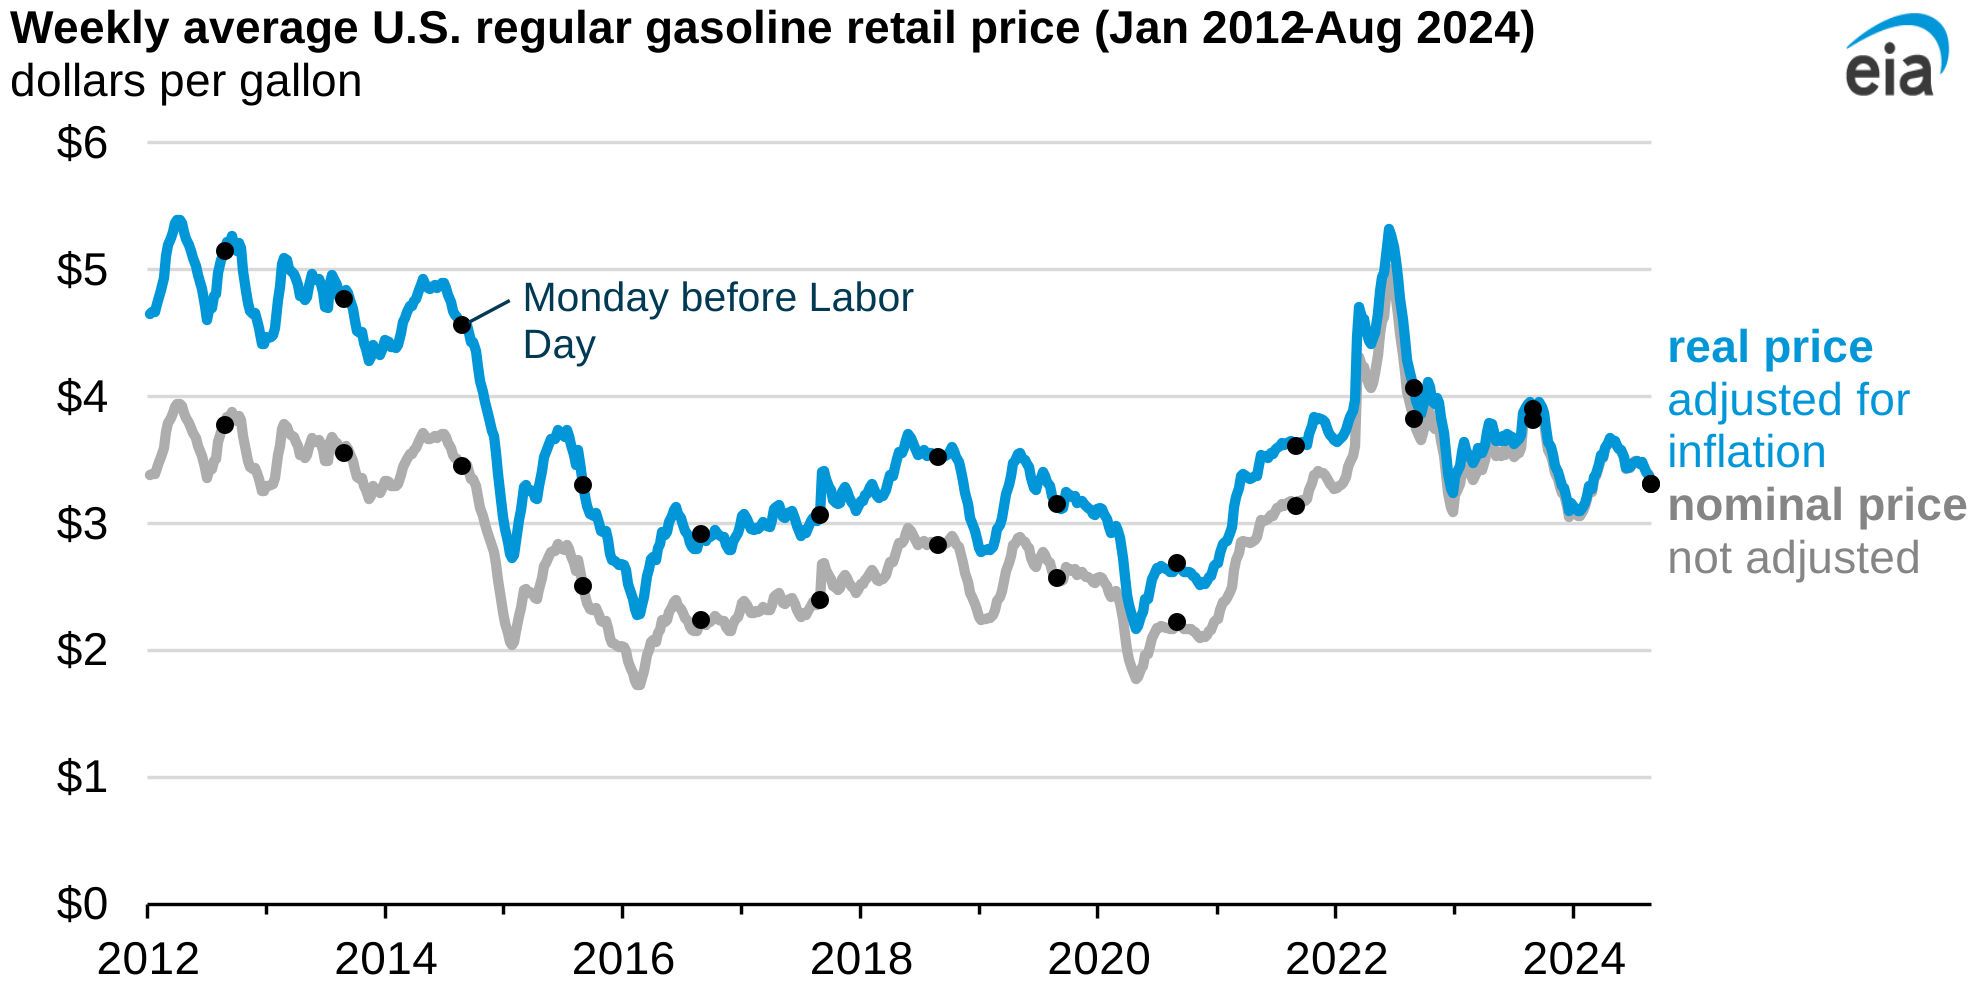
Heading into the holiday weekend, the retail price for all formulations of regular gasoline in the United States averaged $3.31 per gallon (gal) on August 26, 2024, 13% lower than this time last year. The decrease in prices paid at the pump was driven by weak growth in global and U.S. petroleum product demand, continued crude oil production growth from countries outside of OPEC+, and China’s slowing economy.
On June 2, 2024, OPEC+ members announced that most of their crude oil production cuts will extend into 2025 in an attempt to balance global oil supply with demand. Although crude oil and gasoline prices generally increased in the four weeks after the announcement they have since fallen back to around pre-announcement levels.
The cost of crude oil is a major driver of the price of gasoline; we estimate the crude oil price contributed 55% to the price of gasoline as of June 2024. The Brent crude oil price decreased 4% from the same time last year and was $81 per barrel (b) on August 26, 2024. Costs for refining crude oil, distribution and marketing of gasoline, and taxes make up the other components of retail gasoline prices.
Because crude oil, gasoline, and other petroleum products are globally traded commodities, their prices are influenced by economic activity in major producing and consuming nations. Crude oil demand growth in China, the world’s top crude oil importer, has been slower in 2024 compared with previous years due to an economic slowdown, putting downward pressure on prices.
Although the United States has experienced less demand for gasoline for most of this year compared with 2023, we estimate that U.S. demand heading into Labor Day weekend is greater than last year. Nonetheless, more gasoline is currently in U.S. inventories than this time last year, at 221 million barrels, an increase of 3%.
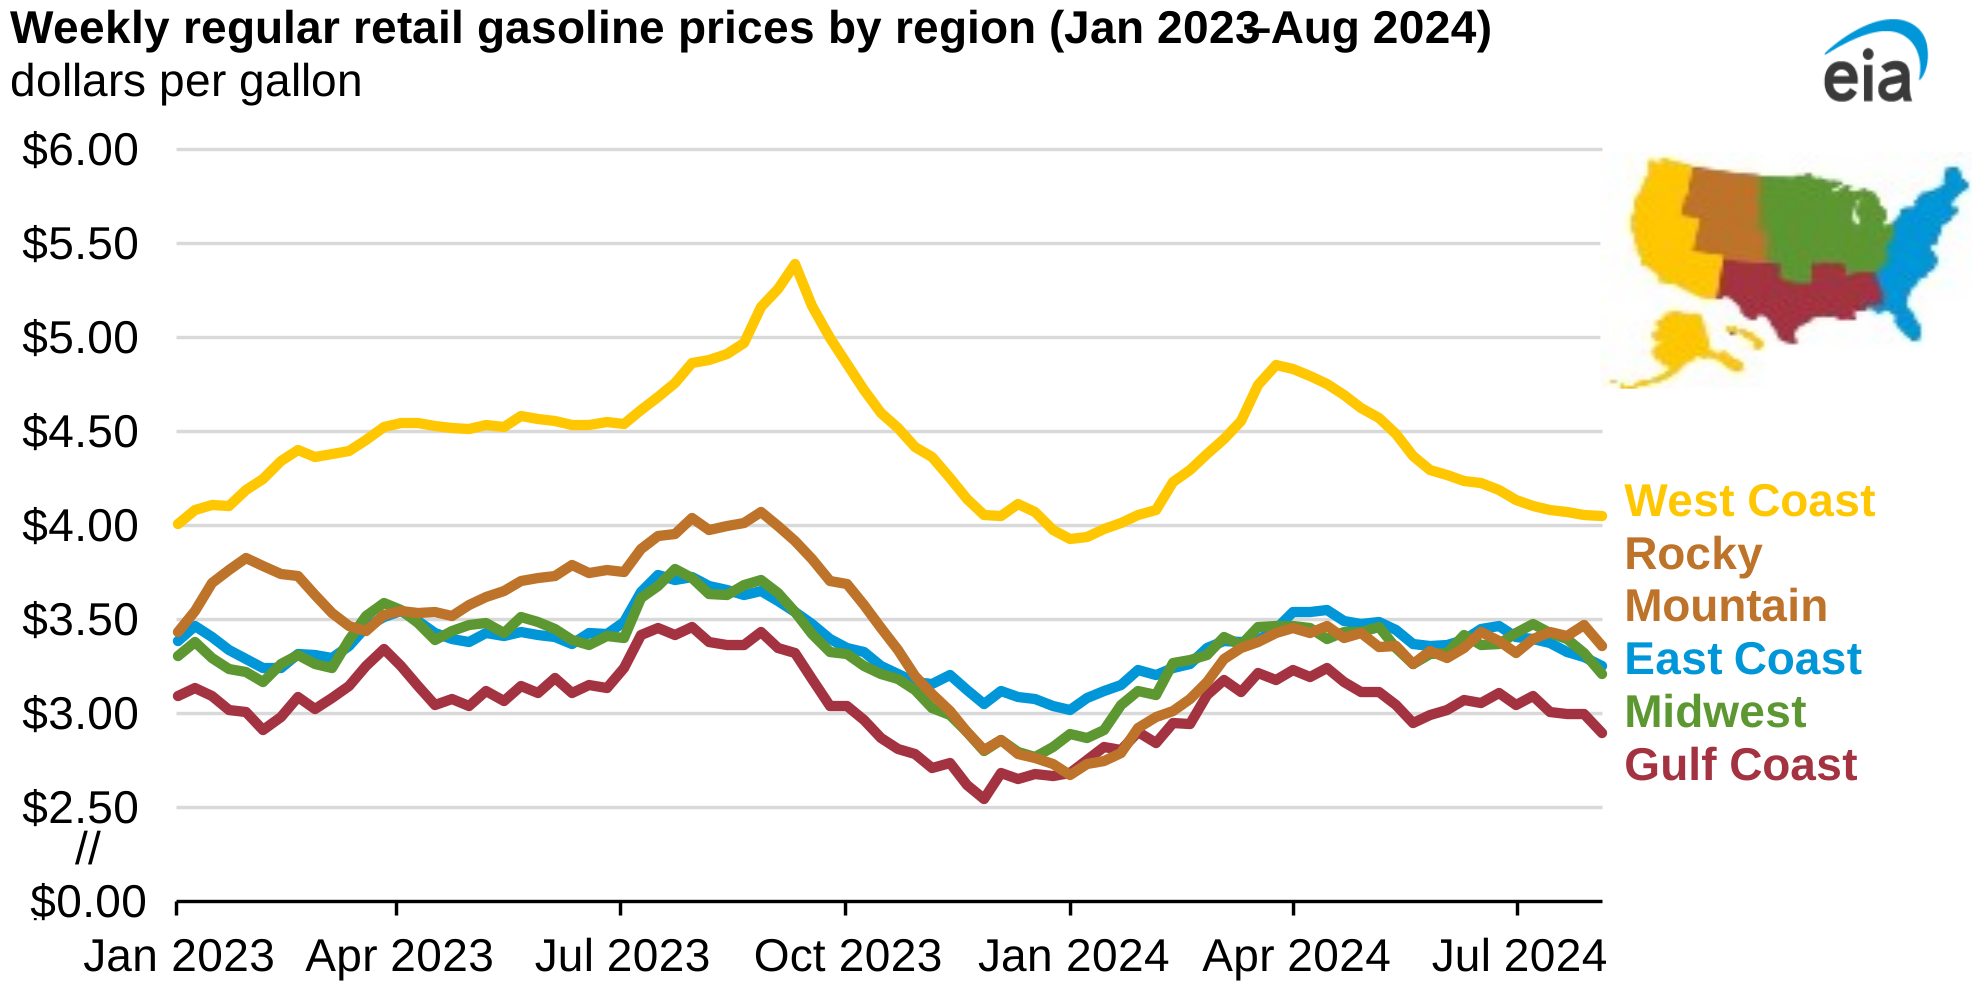
U.S. gasoline prices vary regionally, reflecting local supply and demand conditions, different fuel specifications required by state laws, and taxes. Regional gasoline prices are usually the highest on the West Coast because of the region’s limited interconnections with other major refining centers (including the Gulf Coast), tight local supply and demand conditions, and requirements for gasoline specifications that are more costly to manufacture. West Coast prices as of August 26 averaged $4.05/gal, a decrease of $0.83/gal (17%) compared with the same time last year, the greatest decrease among the different regions. Prices in the other regions were as follows:
- Rocky Mountain prices were $0.62/gal lower, averaging $3.36/gal.
- East Coast prices were $0.43/gal lower, averaging $3.21/gal.
- Midwest prices were $0.42/gal lower, averaging $3.25/gal.
- Gulf Coast prices were $0.48/gal lower, averaging $2.89/gal.
Different weather conditions and unplanned refinery outages can cause different price movements across the regions. In July, Midwest prices increased slightly due to storm-related refinery outages. Gulf Coast oil production and refining was threatened by Hurricane Debby, which made landfall in Florida on August 5, before easing and moving up the East Coast, but the storm did not significantly affect refinery activity or petroleum demand.
Principal contributor: Tara Bennett-Chirico