
Fossil fuels continue to account for the largest share of U.S. energy
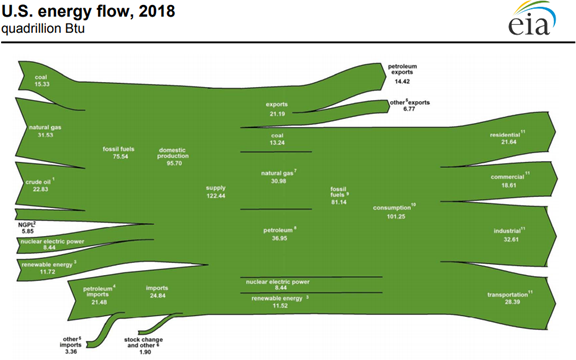
Note: Click for full U.S. total energy flow diagram.
Fossil fuels continue to account for the largest share of energy consumption in the United States. In 2018, about 79% of domestic energy production was from fossil fuels, and 80% of domestic energy consumption originated from fossil fuels.
The U.S. Energy Information Administration (EIA) publishes the U.S. total energy flow diagram to visualize U.S. energy from primary energy supply (production, imports, and stock withdrawals) to disposition (consumption and exports). In this diagram, losses that take place when energy is converted to the secondary forms that are delivered to customers—primarily electricity and gasoline—are allocated to those customers. The result is a visualization that associates the primary energy with customers, even though the amount of energy they purchase is much less.
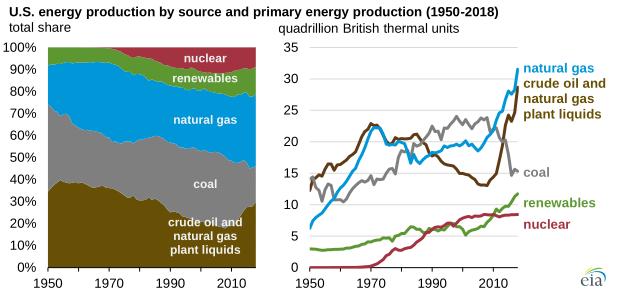
Note: Natural gas plant liquids (NGPL) denoted at top of left panel in brown.
The share of U.S. total energy production from fossil fuels peaked in 1966 at 93%. Total fossil fuel production has continued to rise, but so have non-fossil fuel sources, mainly renewables like wind and solar energy. As a result, fossil fuels have accounted for close to 80% of U.S. energy production over the past decade. Since 2008, production of crude oil, dry natural gas, and natural gas plant liquids (NGPL) has increased by 12 quadrillion British thermal units (quads), 11 quads, and 3 quads, respectively. These increases have more than offset decreasing coal production, which has fallen 9 quads since its peak in 2008.

Petroleum has the largest share of U.S. energy trade, accounting for 67% of energy exports and 86% of energy imports in 2018. Much of the imported crude oil goes to U.S. refineries and is then exported as petroleum products. Petroleum products accounted for 71% of total U.S. energy exports in 2018.
In 2018, net energy imports reached the lowest level since 1963. U.S. net energy imports as a share of consumption peaked in 2005 when it reached 30%; in 2018, energy net imports fell to only 4% of consumption.

The share of U.S. total energy consumption that originated from fossil fuels has fallen from its peak of 94% in 1966 to 80% in 2018. The total amount of fossil fuels consumed in the United States has also fallen from its peak of 86 quads in 2007. Since then, coal consumption decreased by 10 quads and petroleum by 2 quads, more than offsetting a 7 quad increase in natural gas consumption.
EIA previously published articles detailing the energy flows of petroleum, natural gas, coal, and electricity. More information about total energy consumption, production, trade, and emissions is available in EIA’s Monthly Energy Review.
Principal contributor: Allen McFarland