
In 2018, U.S. coal production declined as exports and Appalachian region prices rose
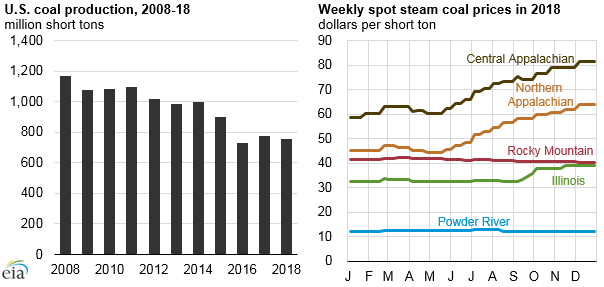
EIA estimates that total 2018 U.S. coal production was 755 million short tons (MMst), 20 MMst less than in 2017 and 36% less than in the previous decade. In 2018, coal prices rose in three of the five major coal-producing regions, particularly the Northern and Central Appalachian regions. Although U.S. coal exports increased by about 10 MMst in 2018, volumes were not great enough to offset the decline in U.S. coal consumption, resulting in declining coal production.
Note: Data for October 2018 through December 2018 are EIA weekly estimates based on coal railcars.
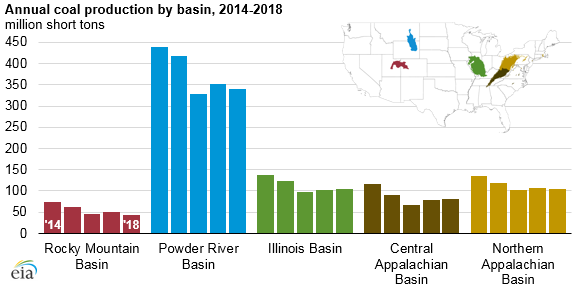
Of the five major coal-producing basins, two saw increased production in 2018 compared with 2017. In the Central Appalachian and Illinois Basins, production increased 4% (3 MMst) and 2% (2 MMst), respectively. The Rocky Mountain region experienced the largest decline as a share of production, 12% (6 MMst) lower than in 2017. The Powder River and Northern Appalachian Basins also declined by 3% and 2%, respectively.
EIA estimates that total coal consumption in the United States was 692 MMst in 2018, falling to the lowest level in 39 years. More than 90% of domestic coal consumption is in the power sector, and nearly 15 gigawatts of coal-fired generation capacity were retired in 2018, contributing to the decline in coal consumption. Although natural gas prices continued to rise in 2018, EIA estimates that the coal share of total power generation declined, reaching a new low of 28%, lower than the natural gas share (35%) for the third consecutive year. Increasing coal prices and demand for coal exports, along with continued competition with natural gas, also contributed to a decline in overall coal consumption.
Coal exports rose for the second consecutive year in 2018, reaching 116 MMst, or 15% of total U.S. coal production. International demand for U.S. coal was driven by Asian and European countries. The largest importers of U.S. coal in Asia were India, Japan, and South Korea. In Europe, the Netherlands was the largest destination with Turkey, Morocco, Croatia, and the United Kingdom showing growth during 2017.
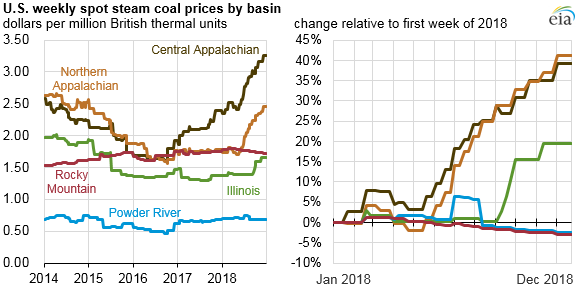
The average price of U.S. steam coal used in electricity generation increased in 2018 in most regions. The price of Northern and Central Appalachian coal, driven by strong international demand for both metallurgical and steam coal, increased by 41% and 39% in 2018, respectively. Illinois Basin coal prices also rose, climbing 19%, while Power River Basin and Rocky Mountain prices fell by 2% and 3%, respectively.
The bituminous coals produced in Appalachian and Illinois Basins have higher heat content than the subbituminous coal produced in the West. Appalachia coals are valued for their coking properties in producing iron and steel both domestically and abroad. The Appalachian regions also benefit from closer proximity to existing coal-exporting infrastructure at Atlantic and Gulf Coast ports.
Principal contributors: Maggie Woodward, David Fritsch, Rosalyn Berry
Tags: prices, production/supply, coal, exports/imports