
During recent cold snap, the U.S. withdrew a record amount of natural gas from storage
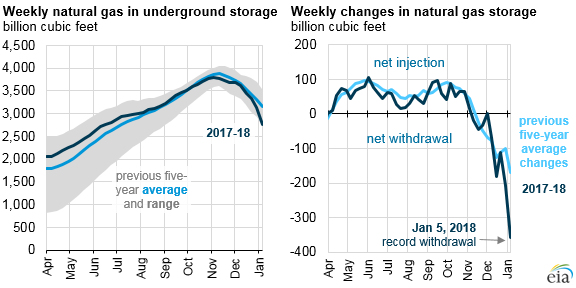
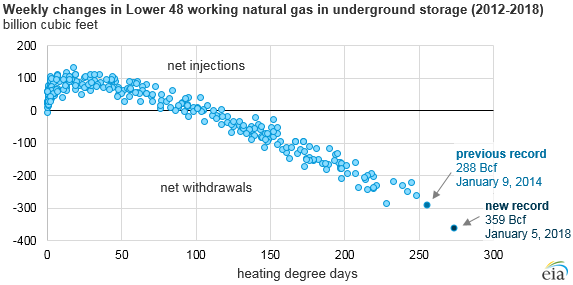
During the recent cold weather event that affected much of the eastern United States, more natural gas was withdrawn from storage fields around the country than at any other point in history. Net withdrawals from natural gas storage totaled 359 billion cubic feet (Bcf) for the week ending January 5, 2018, exceeding the previous record of 288 Bcf set four years ago.
Near the end of December 2017 and continuing into January, temperatures in the Lower 48 states, especially in the eastern half of the country, were significantly lower than normal. Similar to January 2014, sustained periods of cold temperatures resulted in high natural gas demand for heating, contributing to increased withdrawals from storage. Population-weighted heating degree days, which are correlated with heating demand, increased to 273, indicating that weather was much colder than experienced during the previous record withdrawal, when heating degree days reached 255 for the week ending January 9, 2014.
Consumption of natural gas in the residential and commercial sectors reached 452 Bcf during the week ending January 5, compared with 348 Bcf during the previous week, according to estimates from PointLogic Energy. PointLogic Energy estimated that total weekly natural gas consumption in the Lower 48 states increased by 150 Bcf, reaching 961 Bcf for the week ending January 5. Another 29 Bcf and 21 Bcf were exported by pipeline to Mexico and as liquefied natural gas (LNG), respectively.
Freezing temperatures also had an impact on natural gas production, as cold temperatures led to freeze-offs in the Appalachian and Permian basins. Freeze-offs occur when water vapor in the natural gas stream freezes and blocks the flow of gas. Dry natural gas production totaled a record high of 539 Bcf during the December 29, 2017 report week, but declined to 517 Bcf during the following week, according to estimates from PointLogic Energy.
Pipeline imports from Canada and LNG imports increased during this period, partially offsetting some of the production declines, while withdrawals of natural gas from storage played a key role in meeting natural gas demand and limiting some market participants’ exposure to spikes in natural gas spot prices.
On a regional basis, the largest decline in natural gas storage was in the South Central region, where inventories fell by 153 Bcf. About half of that region’s decline was in South Central’s salt fields, which fell by 78 Bcf, or 26% of the previous week’s level. Salt fields are able to cycle gas much more rapidly than other storage types such as depleted fields or aquifers.
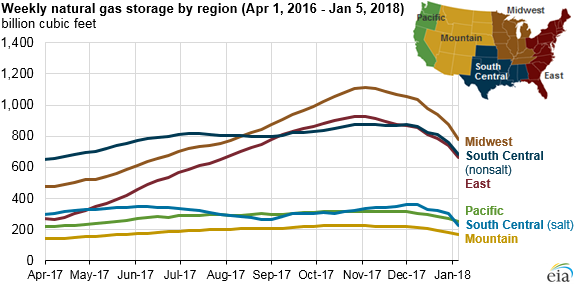
Working natural gas storage levels now total 2,767 Bcf in the Lower 48 states. If withdrawals from storage match the five-year (2013–17) average for the remainder of the heating season, which typically runs through the end of March, working gas stocks are expected to reach 1,310 Bcf, much lower than the previous five-year average level of 1,697 Bcf for the end of the heating season.
Principal contributor: Jose Villar
Tags: consumption/demand, natural gas, storage, weather