
Hydroelectric generators are among the United States’ oldest power plants
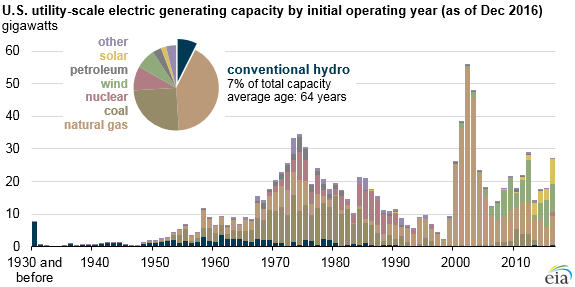
Conventional hydroelectric generators account for 7% of the operating electricity generating capacity in the United States and about 6% to 7% of U.S. electricity generation each year. Conventional hydroelectric plants are different from pumped-storage facilities, which produce electricity from water previously pumped to an upper reservoir. Many of these generators are among the oldest power plants in the United States. Hydropower plants account for 99% of all currently operating capacity built before 1930. Until 2014, hydroelectricity exceeded the electricity produced by all other renewable sources combined.
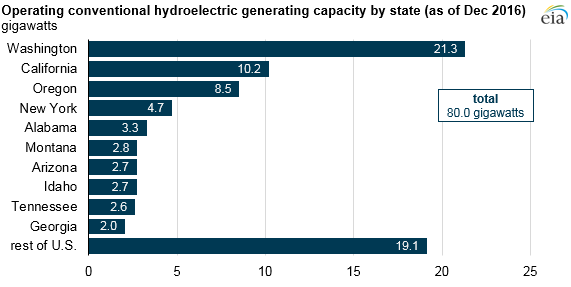
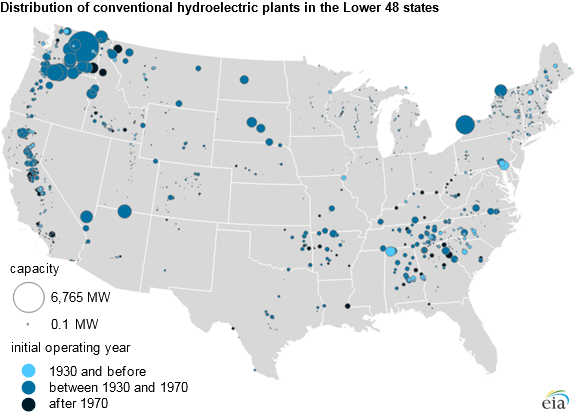
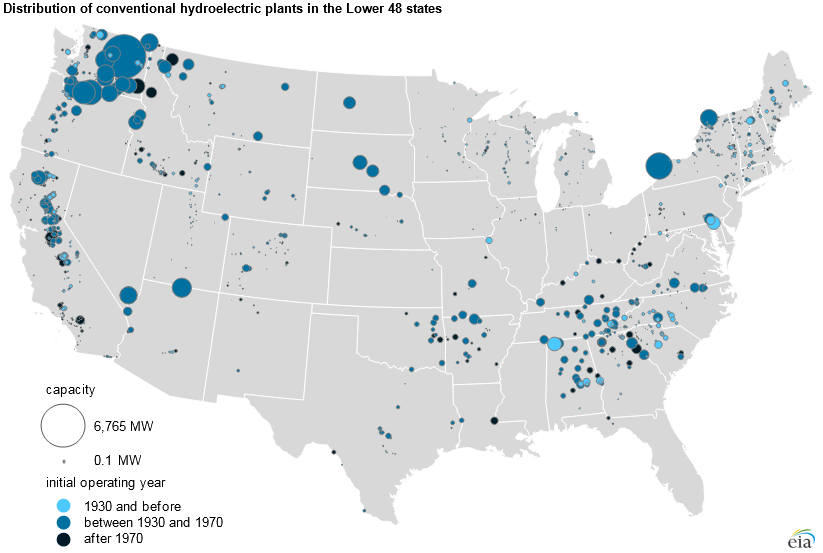
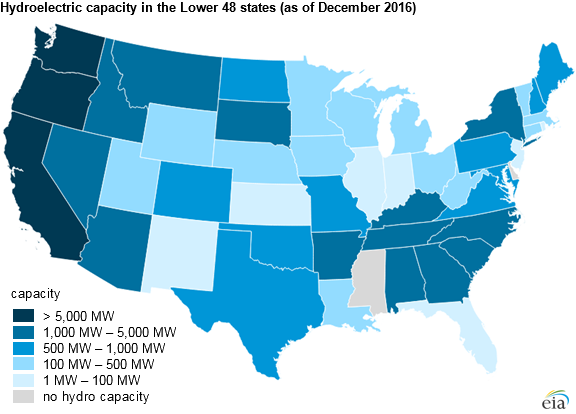
Half of U.S. hydroelectricity capacity is located in three states: Washington, California, and Oregon. Four states—Washington, Idaho, Oregon, and Vermont—depend on hydroelectricity facilities for at least half of their in-state utility-scale generating capacity. Many states have limited locations with hydroelectricity potential, but only two states, Delaware and Mississippi, have no utility-scale hydroelectricity generating facilities.
The average hydroelectric facility has been operating for 64 years. The 50 oldest electric generating plants in the United States are all hydroelectric generators; each has been in service since 1908. Of the nearly 200 GW of total capacity added in the previous decade (2007–16), only 1.7 GW has been conventional hydro. Of that 1.7 GW, more than half (0.9 GW) was installed in Washington state.
In California, deterioration of spillways at the California Department of Water Resources' Oroville Dam has focused attention on the age of several hydroelectric facilities. The six generators at the Edward C Hyatt hydroelectric facility at the Oroville Dam began operation in 1968, making them younger than about 63% of California’s currently operating hydroelectric facilities. California depends on conventional hydroelectricity for 13% of its utility-scale generating capacity, and Edward C Hyatt’s 743-megawatt generating station accounts for 7% of that capacity.
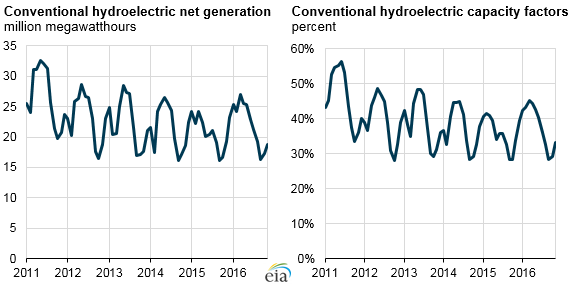
The amount of power generated each year from the nation’s hydroelectric facilities varies by the water available in dams and rivers. Many reservoirs must balance power output with competing water demand for irrigation, municipal, industrial, and other needs, as well as concerns with fish migration. As a result, hydroelectric facilities often do not run at full output. U.S. hydroelectric capacity factors, which measure actual output as a percent of total capacity, average between 30% and 40%.
Hydroelectricity generating capacity has increased slightly in recent decades. Capacity can be increased at existing facilities by either adding or repowering turbines. Turbines have also been added at previously nonpowered dams, such as those used for flood control.
Source: U.S. Energy Information Administration, Preliminary Monthly Electric Generator Inventory
Note: Click to enlarge.
Source: U.S. Energy Information Administration, Preliminary Monthly Electric Generator Inventory
Note: Click to enlarge.
This article is part of a series of Today in Energy articles examining the fleet of utility-scale power plants in the United States. Other articles have examined coal, natural gas, nuclear, wind, solar, petroleum, and other generators.
Principal contributor: Allen McFarland
Tags: generating capacity, generation, hydroelectric, map