
Pennsylvania is the fastest-growing natural gas-producing state
Note: Rankings based on marketed production figures.
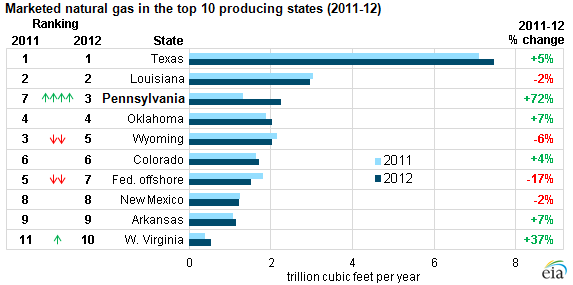
From 2011 to 2012, Pennsylvania's marketed natural gas (which includes natural gas plant liquids) production grew by 72%, moving it from the seventh-largest to the third-largest marketed gas-producing state in the United States, according to the Natural Gas Annual, 2012. Preliminary data (as well as estimates from the Drilling Productivity Report) indicate that continued Marcellus production may result in Pennsylvania becoming the second-largest producer in 2013. Tight gas development significantly increased production in several regions, including the Marcellus in the Northeast and the Eagle Ford in Texas. Marketed production in the Lower 48 states increased by 5% between 2011 and 2012, rising from 23.7 trillion cubic feet (Tcf) to 25.0 Tcf.
Pennsylvania also saw the largest volume and percentage increases in marketed gas. West Virginia, which is also located in the Marcellus Shale play, joined the ranks of the top 10 largest U.S. producers for the first time in 2012, producing 146 billion cubic feet (Bcf) of additional marketed gas compared with the 2011 level. Production in the Marcellus region has grown so substantially that spot prices in the Northeast may continue to drop further below the Henry Hub spot price in the future. Texas, home to the Eagle Ford Shale play, grew 5% year-on-year, and stands as the largest gas-producing state by far.
A few states experienced drops in production levels between 2011 and 2012. Wyoming, which produces significant volumes of coalbed methane, fell two places in the marketed natural gas production ranking, from number three to number five. Federal offshore production, which includes federal production from both the Gulf of Mexico and the Pacific Ocean (California), also fell in the ranking, from number five to number seven. Federal Gulf of Mexico natural gas production has generally declined since 2001, and federal Pacific offshore production has generally declined since 2002.
Principal contributor: Mike Kopalek