Markets expect Marcellus growth to drive Appalachian natural gas prices below Henry Hub
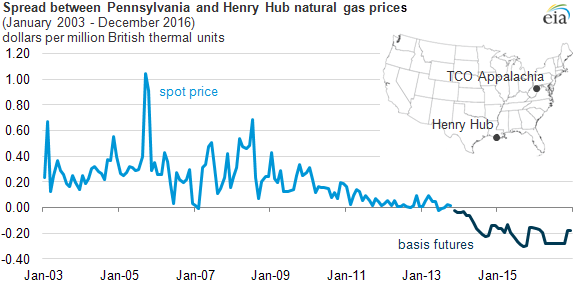
Note: Spot prices computed by averaging daily prices for TCO Appalachia and Henry Hub points and then subtracting the average monthly price for Henry Hub from TCO Appalachia. A negative price means that TCO Appalachia has a lower price than Henry Hub. The forward price for TCO Appalachia is the Nymex basis futures contract.
Growth in natural gas production from the Marcellus region of Pennsylvania, West Virginia, and Ohio has lowered the spot price of natural gas at the TCO Appalachia trading point in recent years. Forward market prices for natural gas indicate that this production growth will continue, driving the price in this region below the benchmark Henry Hub price early next year.
The benchmark price for natural gas in the United States is the Henry Hub price point located in Erath, Louisiana. A common way to express prices at different locations across North America is the difference (often called basis) between the price at a particular location and the price at Henry Hub.
Natural gas prices in the Mid-Atlantic have traditionally been more expensive than Henry Hub, reflecting the cost of moving natural gas from the production in the Gulf region to consumers along the east coast. Increased production from the Marcellus region began changing that relationship in 2011.
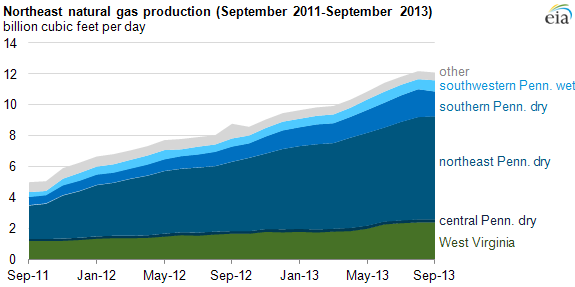
Natural gas production in the Northeast has grown by about 3.2 billion cubic feet per day (Bcf/d) so far in 2013, a 30% increase from the same period last year. Total natural gas production in this region reached 12.2 Bcf/d in August, a 4.1-Bcf/d increase from August 2012 and a 2.5-Bcf/d increase from the end of last year.
Growth is mostly from dry gas production in northeastern Pennsylvania. This coincides with infrastructure improvements in the region, as gathering lines and pipeline capacity expansions have helped flow more gas to market. Production in West Virginia reached 2.4 Bcf/d in August, which is 0.8 Bcf/d above the August 2012 level, with 0.6 Bcf/d of that growth occurring in 2013. The liquids-rich areas of the state experienced the most growth as a result of the beginning of operations at two new natural gas processing facilities—the Mobley (Wetzel County, WV) and Natrium (Marshall County, WV) plants—and the expansion of several existing plants.
The forward curve for TCO Appalachia was also negative relative to Henry Hub in the middle of 2012, but unusually cold winter weather in late 2012 and early 2013 changed the dynamic in the spot market. Forward markets give market participants financial tools, like the basis futures shown in the chart above, to exchange risk; but they can also reflect how expectations about supply and demand may affect prices in the future. Spot prices, on the other hand, principally reflect how current market conditions such as changes in weather affect actual production and consumption and, in turn, physical market prices on a given day.
Principal contributor: Chris Peterson
Tags: Louisiana, Marcellus, natural gas, Pennsylvania, West Virginia