
U.S. crude oil exports reached record levels in 2020 and remain high in 2021
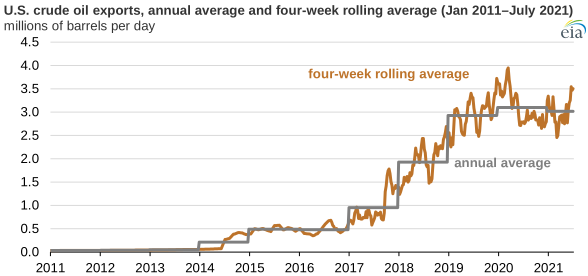
Note: 2021 annual average based on year-to-date data as of July 9, 2021.
Despite volatility in global oil markets, U.S. crude oil exports reached a record high in 2020. So far this year (as of July 9, 2021), U.S. crude oil exports have averaged 3.00 million barrels per day (b/d). The most recent four-week rolling average of U.S. crude oil exports reached 3.51 million b/d, according to our Weekly Petroleum Status Report.
In 2013, the U.S. government lifted export restrictions on minimally processed ultra-light oil. In the summer of 2015, the United States and Mexico entered into an oil exchange agreement, and the restrictions on oil exports were fully lifted in December 2015. U.S. crude oil exports have increased significantly since 2015 and have averaged around 3.00 million b/d every year since 2019.
The four-week rolling average of U.S. crude oil export volumes has not fallen below 2.00 million b/d during the past three years, despite the COVID-19 pandemic, which caused significant crude oil price drops, reduced demand, and reduced production in U.S. and global oil markets.
High oil prices have contributed to steady crude oil exports recently. During the week of July 9, 2021, the international crude oil benchmark (Brent) spot price averaged $76.13 per barrel (b), and the domestic crude oil benchmark (West Texas Intermediate, or WTI) spot price averaged $73.35/b. Brent and WTI prices both remained above $70/b between June 8 and July 16, 2021. Weekly export data from our Weekly Petroleum Status Report show a slight rise in crude oil exports since the end of June 2021.
Even with a narrow price difference between the WTI crude oil price and the Brent price, U.S. crude oil exports remain very high. As of July 16, the WTI crude oil price averaged $2.82/b lower than the Brent crude oil price so far in 2021. During the week ending July 9, 2021, the WTI price averaged $2.78/b lower than the Brent price. U.S. crude oil exports for that same week were 3.51 million b/d, well above the year-to-date 2021 average volume for U.S. crude oil exports. Between 2011 and 2014, the WTI crude price averaged $10/b lower than the Brent crude price.
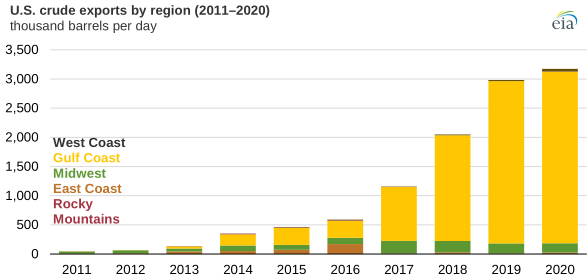
U.S. crude oil infrastructure has expanded significantly since 2015 to facilitate crude oil exports from onshore production. Ports on the Texas Gulf Coast, particularly Corpus Christi and Houston, have led the expansion, allowing more oil to be exported from the Permian Basin and Eagle Ford Basin. Due to the Gulf Coast’s many pipeline connections and efficient port infrastructure, most U.S. crude oil exports leave the United States from the Gulf Coast region.
Principal contributors: Jozef Lieskovsky, Richard Yan