
We no longer publish This Week in Petroleum (TWIP). The data that was published in TWIP remains current and can be found elsewhere on the website, in the Weekly Petroleum Status Report and Heating Oil and Propane Update. An archive of past editions is below.
All the data found here are provided elsewhere on the website. Charts and graphs will no longer be updated. All data links below continue to be updated as part of other data products, primarily the Weekly Petroleum Status Report.
| Note: Futures Prices after April 5, 2024, are not available. |
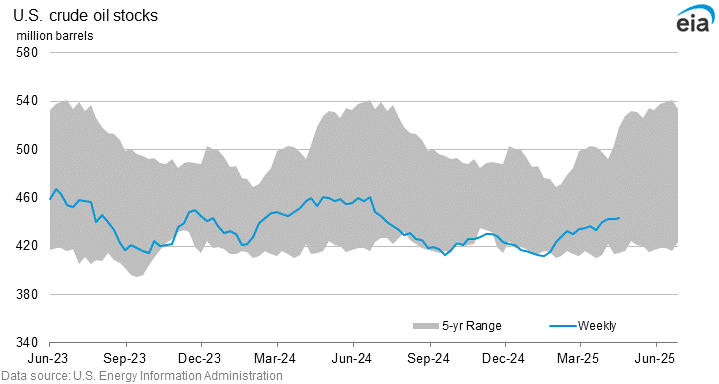
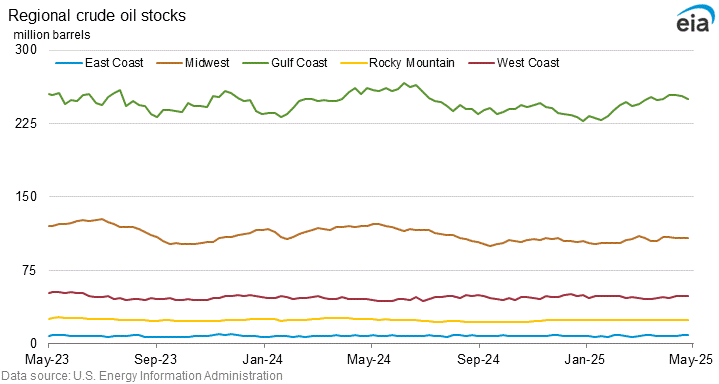
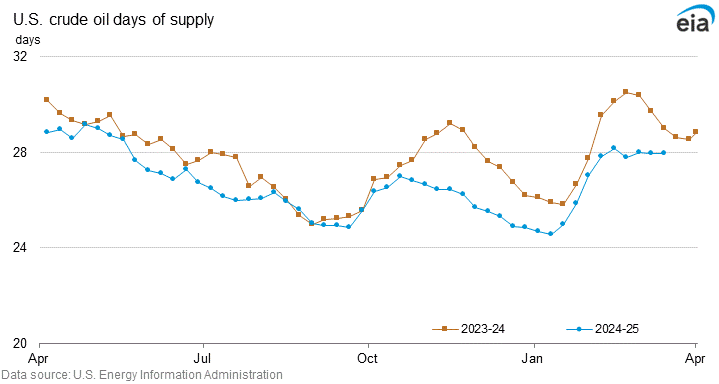
Crude oil stocks (million barrels) and days of supply
| Year ago | Most recent | |||||||
|---|---|---|---|---|---|---|---|---|
| 10/25/24 | 10/24/25 | 10/17/25 | 10/10/25 | 10/03/25 | 09/26/25 | 09/19/25 | 09/12/25 | |
| U.S. | 425.5 | 416.0 | 422.8 | 423.8 | 420.3 | 416.5 | 414.8 | 415.4 |
| East Coast (PADD 1) | 8.0 | 8.1 | 7.6 | 8.1 | 6.7 | 7.0 | 8.0 | 7.4 |
| Midwest (PADD 2) | 105.6 | 103.7 | 101.6 | 102.0 | 100.7 | 101.6 | 103.2 | 103.0 |
| Cushing, Oklahoma | 25.4 | 22.6 | 21.2 | 22.0 | 22.7 | 23.5 | 23.7 | 23.6 |
| Gulf Coast (PADD 3) | 241.6 | 234.3 | 244.3 | 244.6 | 244.5 | 238.3 | 234.3 | 237.4 |
| Rocky Mountain (PADD 4) | 22.2 | 23.4 | 23.5 | 23.1 | 22.4 | 22.8 | 22.7 | 22.6 |
| West Coast (PADD 5) | 48.1 | 46.5 | 45.8 | 46.0 | 46.0 | 46.8 | 46.5 | 45.0 |
| Year ago | Most recent | |||||||
|---|---|---|---|---|---|---|---|---|
| 10/25/24 | 10/24/25 | 10/17/25 | 10/10/25 | 10/03/25 | 09/26/25 | 09/19/25 | 09/12/25 | |
| U.S. | 26.8 | 26.7 | 26.7 | 26.5 | 25.7 | 25.3 | 24.9 | 24.8 |
| Note: Days of Supply calculated as: U.S. crude oil stocks / Four-week average U.S. crude oil refinery inputs | ||||||||
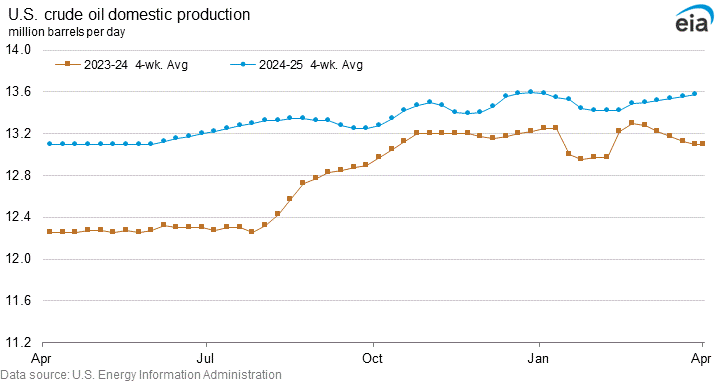
Crude oil production, imports, and exports (million barrels per day)
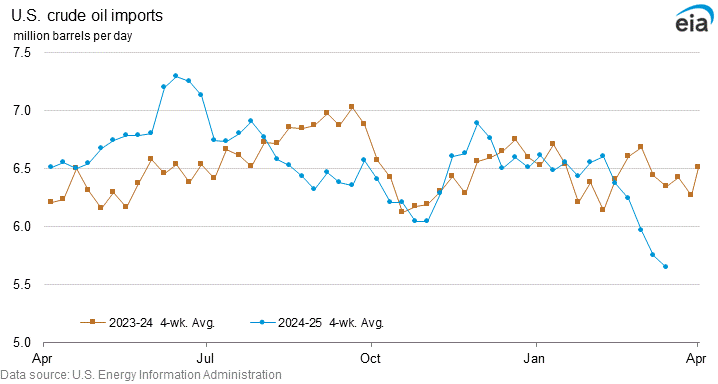
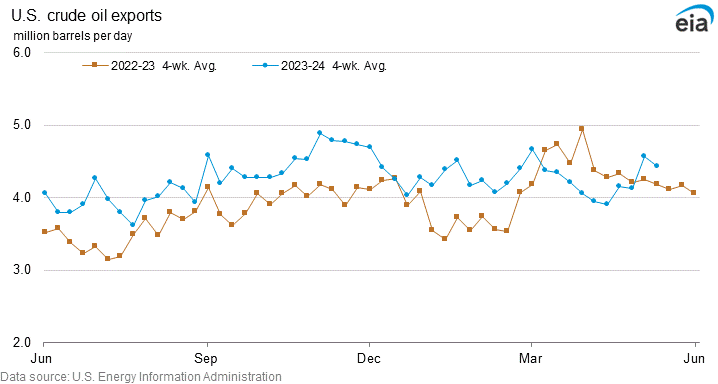
| Year ago | Four-week averages | Year ago | Week ending | |||||
|---|---|---|---|---|---|---|---|---|
| 10/25/24 | 10/24/25 | 10/17/25 | 10/10/25 | 10/25/24 | 10/24/25 | 10/17/25 | 10/10/25 | |
| U.S. production | 13.475 | 13.635 | 13.600 | 13.568 | 13.500 | 13.644 | 13.629 | 13.636 |
| Year ago | Four-week averages | Year ago | Week ending | |||||
|---|---|---|---|---|---|---|---|---|
| 10/25/24 | 10/24/25 | 10/17/25 | 10/10/25 | 10/25/24 | 10/24/25 | 10/17/25 | 10/10/25 | |
| U.S. Crude oil, excluding SPR | 6.043 | 5.724 | 5.920 | 6.064 | 5.975 | 5.051 | 5.918 | 5.525 |
| Year ago | Four-week averages | Year ago | Week ending | |||||
|---|---|---|---|---|---|---|---|---|
| 10/25/24 | 10/24/25 | 10/17/25 | 10/10/25 | 10/25/24 | 10/24/25 | 10/17/25 | 10/10/25 | |
| U.S. exports | 4.073 | 4.155 | 4.003 | 4.073 | 4.261 | 4.361 | 4.203 | 4.466 |
Crude oil refinery inputs (million barrels per day)
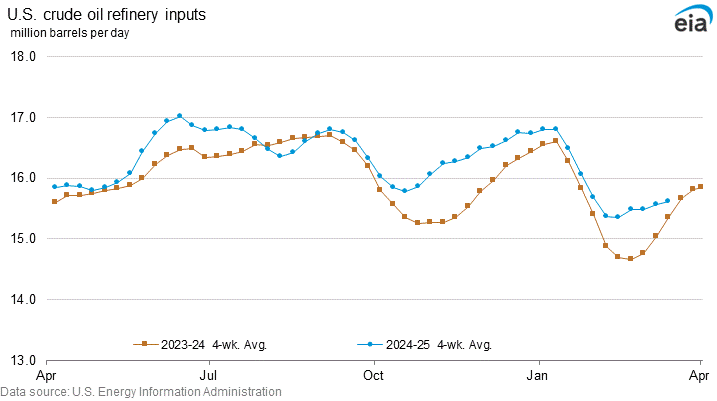
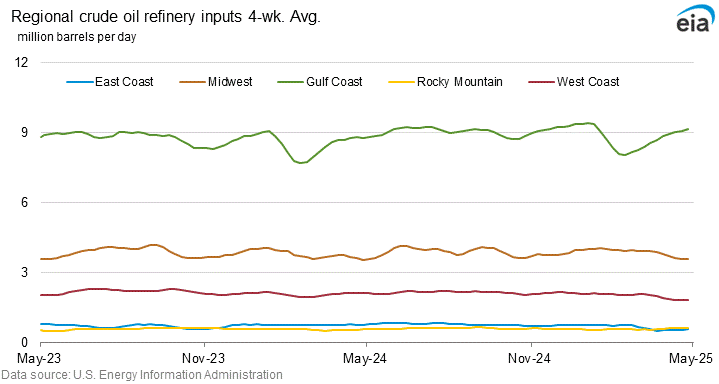
| Year ago | Four-week averages | Year ago | Week ending | |||||
|---|---|---|---|---|---|---|---|---|
| 10/25/24 | 10/24/25 | 10/17/25 | 10/10/25 | 10/25/24 | 10/24/25 | 10/17/25 | 10/10/25 | |
| U.S. | 15.870 | 15.594 | 15.831 | 16.018 | 16.053 | 15.219 | 15.730 | 15.130 |
| East Coast (PADD 1) | 0.730 | 0.835 | 0.811 | 0.794 | 0.672 | 0.839 | 0.847 | 0.828 |
| Midwest (PADD 2) | 3.644 | 3.656 | 3.809 | 3.901 | 3.679 | 3.418 | 3.635 | 3.589 |
| Gulf Coast (PADD 3) | 8.844 | 8.608 | 8.623 | 8.646 | 9.052 | 8.555 | 8.781 | 8.271 |
| Rocky Mountain (PADD 4) | 0.597 | 0.599 | 0.608 | 0.614 | 0.607 | 0.603 | 0.599 | 0.575 |
| West Coast (PADD 5) | 2.055 | 1.897 | 1.981 | 2.063 | 2.043 | 1.803 | 1.870 | 1.866 |
Abbreviations: NA = Not Available | W = Data Withheld