
Most U.S. wind capacity built since 2011 is located in the center of the country
Note: Regions are based on EIA’s Short-Term Energy Outlook electricity supply regions.
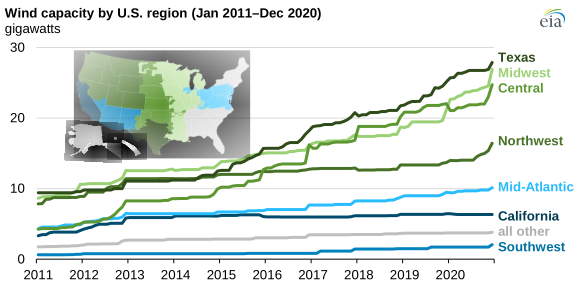
Wind capacity in the United States has increased significantly over the past decade, from 40.1 gigawatts (GW) in January 2011 to 118.3 GW at the end of 2020. This wind capacity growth was mostly concentrated in the middle of the country.
The Texas, Midwest, and Central regions—home to some of the country’s most prolific wind resources—combined accounted for the largest share of U.S. wind capacity growth from 2011 to 2020 with 73% of additions. At the beginning of 2011, the Texas region (which covers the area served by ERCOT) had 9.4 GW of wind capacity; by the end of 2020, capacity had grown to 27.9 GW. Wind capacity in the Midwest region tripled, rising from 8.6 GW in 2011 to 26.9 GW in 2020. In 2011, the Central region had about half the wind capacity of the Texas and Midwest regions. After adding more wind capacity (20.5 GW) in the last decade than any other region, the Central region is now one of the top U.S. wind capacity regions.
Despite having similar wind capacity as the Texas and Midwest regions in 2011, the Northwest region installed far less new wind capacity (8.6 GW) between 2011 and 2020 than those regions.
The California region (which includes all but the northernmost part of the state) added 3.0 GW of wind capacity between 2011 and 2020, accounting for 4% of national wind capacity growth. Although California was an early adopter of utility-scale wind turbines, it has not had the high wind capacity growth in the last decade that some other regions have had.
The United States added a record amount (14.2 GW) of annual wind capacity in 2020. Previously, the most wind capacity added in a single year in the United States was 13.2 GW installed in 2012.
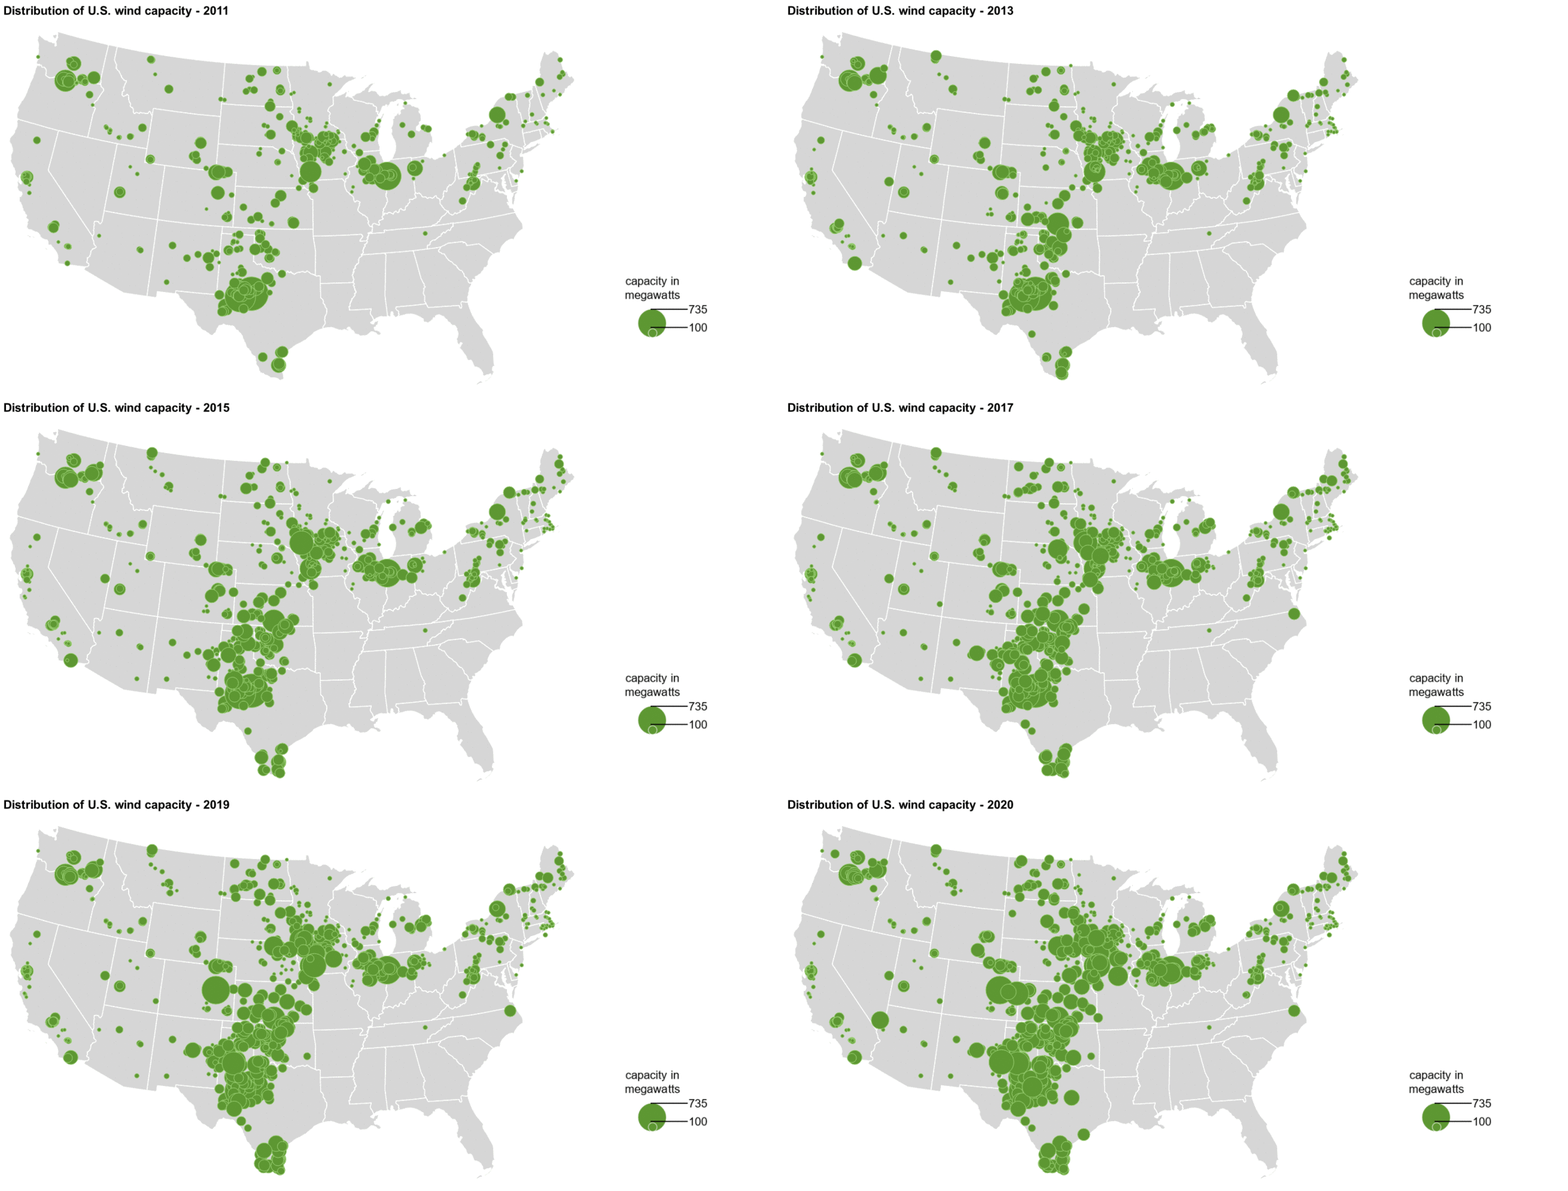
Both the California and Mid-Atlantic regions had their highest annual wind capacity additions in 2012. The Central region also had significant wind capacity growth in 2012, at 3.3 GW, which was slightly less than its regional high of 3.5 GW added in 2016.
In 2020, the Midwest and Northwest regions experienced their largest annual wind capacity additions, adding 5.7 GW and 2.7 GW, respectively. Many of the capacity additions in recent years have been driven by declining construction costs for wind farms and increases in state-level renewable portfolio standards (RPS).
Principal contributors: Richard Bowers, Elesia Fasching
Tags: generation, electricity, wind, capacity