
EIA’s weekly natural gas products provide timely natural gas information
The U.S. Energy Information Administration (EIA) provides daily and weekly information on natural gas market activity and drivers in three weekly products: the Weekly Natural Gas Storage Report, the Natural Gas Storage Dashboard, and the Natural Gas Weekly Update.
Natural gas is a significant source of energy in the United States, accounting for nearly one-third of total U.S. energy consumption last year. Natural gas is used to fuel power plants, to heat and provide hot water for homes and buildings, and as feedstock for industrial facilities and other uses.
Weekly Natural Gas Storage Report
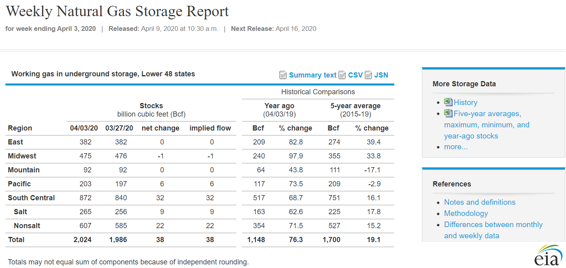
The Weekly Natural Gas Storage Report (WNGSR) is the U.S. government’s only Principal Federal Economic Indicator that provides weekly data; other indicators report either monthly or quarterly data. WNGSR reports the underground working natural gas storage level as of the previous Friday, weekly net change, comparisons to historical levels and net changes, and statistical measures for each of five regions in the Lower 48 states. The five-region data series goes back to 2010.
WNGSR estimates, released on Thursday at 10:30 a.m. Eastern Time (except certain weeks with holidays), are based on EIA’s statistical survey of storage operators that covers about 95% of working natural gas storage capacity in each of the five regions.
Underground natural gas storage inventories in the Lower 48 states rose from the near-typical levels (or the five-year average) at the start of the 2019 heating season (November 1) of 3,726 billion cubic feet (Bcf) (1% more than the previous five-year average) to 19% more at the end of winter (March 31, 2020). This increase was the result of mild winter weather across much of the country that led to reduced space heating demand and greater natural gas production.
End-of-winter season (March 31, 2020) inventory was 2,008 Bcf—the 4th-highest level for end-of-winter inventory and 315 Bcf higher than the five-year average. WNGSR inventory estimates further show that regional underground natural gas storage facilities were between 35% full (in the Mountain Region) and 63% full (in the salt storage facilities in the South Central Region) as of the end of winter.
Natural Gas Storage Dashboard
The Natural Gas Storage Dashboard is a supplement to the WNGSR that provides information on key market fundamentals that affect underground natural gas storage activity. The dashboard is updated each Thursday to reflect the latest WNGSR values. It provides both weekly and daily information on weather, residential and commercial natural gas consumption, natural gas use for electricity generation, net exports of natural gas, status of U.S. nuclear fleet outages, utilization of regional working gas capacity, and trends in natural gas futures prices.
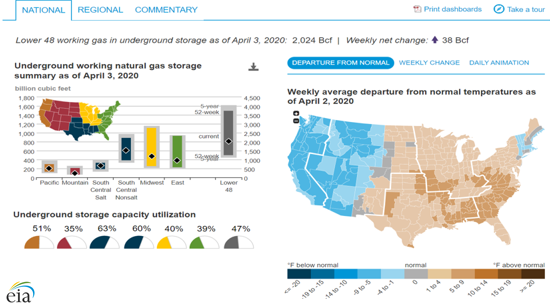
The interactive dashboard enables users to select national or regional information, choose specific years or ranges, animate trends, and download selected data series or images. In addition to data visualizations, the commentary section provides analysis of recent natural gas storage-related market conditions.
Natural Gas Weekly Update
EIA’s Natural Gas Weekly Update (NGWU) publishes a summary of recent natural gas market activity each Thursday afternoon. NGWU is headlined by a short article called In the News, which highlights a current natural gas-related issue or trend.
NGWU publishes graphs and tables with weekly and daily data using third-party information. These market indicators include spot and futures market prices, supply and consumption statistics, and liquefied natural gas (LNG) export volumes. NGWU also features third-party information on upstream natural gas activity such as rig counts and monthly shale gas production numbers by play. EIA’s WNGSR values are also recapped in the NGWU.
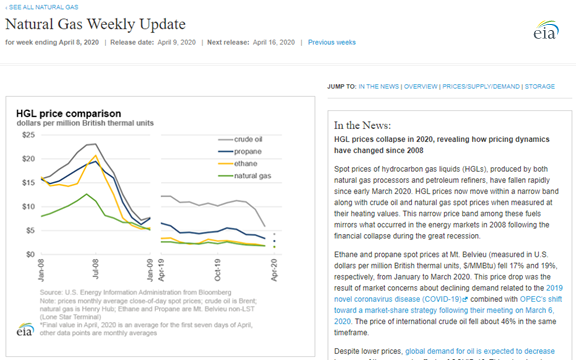
So far this year, NGWU analyses have focused on a variety of topics, including winter natural gas consumption, natural gas use for power generation, natural gas storage and LNG developments abroad, natural gas infrastructure, and national and regional prices.
Principal contributor: Barbara Mariner-Volpe
Tags: storage, natural gas