
In late January, Gulf Coast gasoline crack spreads reached their lowest levels since 2014
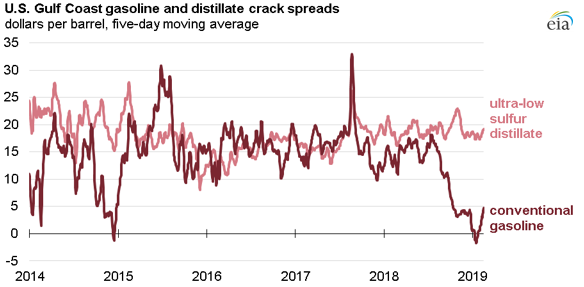
Note: Crack spread calculations use the price of Mars crude oil.
U.S. Gulf Coast gasoline crack spreads had been declining since mid-2018 and briefly went negative in January and early February 2019 before rising, while distillate crack spreads remained relatively stable. The gasoline crack spread is the difference between the spot prices of gasoline and crude oil. EIA attributes relatively low gasoline crack spreads to more costly crude oil inputs and high gasoline inventories.
Crack spreads in U.S. Gulf Coast petroleum product markets are typically among the world’s highest because, among other factors, Gulf Coast refineries have upgraded their equipment to refine lower-cost heavy crude oils into more valuable refined products, such as gasoline. Their complexity also facilitates relatively high yields of higher value products such as distillate and jet fuel and low yields of lower value residual fuel oil compared with simpler refineries.
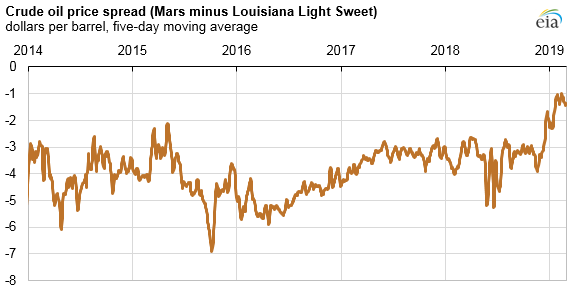
Since December, prices of medium and heavy crude oils with higher sulfur content have increased relative to prices of light, sweet crude oils. This price increase is likely because of the reduction in output from producers within the Organization of the Petroleum Exporting Countries (OPEC) and Canada and the threat of production disruptions in Venezuela. These countries tend to produce medium and heavy grades of crude oil with higher sulfur content, so a large share of the global oil supply reductions since January has been of this quality.
Because U.S. Gulf Coast refineries have upgraded equipment such as cokers, they typically process crude oils that have lower API gravities (meaning they are relatively dense and heavy) and have higher sulfur content, which are typically less expensive than light, sweet crude oils. Based on a five-day moving average, the price spread between the price of Mars—a medium, sour crude oil produced in the U.S. Gulf of Mexico—and the price of Light Louisiana Sweet (LLS) crude oil narrowed to within $1 per barrel in late January after trading between $3 to $4 per barrel less than LLS for most of 2017 and 2018.
Gasoline crack spreads typically decline to their lowest levels of the year in the winter months, but this winter has seen some of the lowest crack spreads on record. Futures prices for gasoline crack spreads compared with Brent crude oil futures prices have been negative for most trading days since November 2018, and spot Gulf Coast gasoline crack spreads with Mars crude oil fell to less than $0 per barrel in late January 2019. Crack spreads increased in the first week of February, but they remained much lower than average through the end of the month.
In addition to higher crude oil costs, U.S. Gulf Coast gasoline crack spreads have declined in part because of high inventory levels. In the U.S. Gulf Coast, a region with 34% of the nation’s motor gasoline storage capacity, gasoline inventories reached an all-time high of nearly 91 million barrels for the week ending January 11, 12% higher than the five-year (2014–18) average, before declining to 8% higher than the five-year average by February 22. Outside of the United States, gasoline inventories are relatively high in several major global storage hubs, further contributing to low gasoline crack spreads.
Principal contributor: Jeff Barron
Tags: gasoline, Gulf Coast, crack spread, liquid fuels