
EIA now publishes petroleum export data by U.S. region of origin and destination country
Starting with the May 2018 release of the Petroleum Supply Monthly, EIA now publishes U.S. petroleum export data by region, defined as Petroleum Administration for Defense District (PADD), of origin and by country of destination. Before this change, users could only see the total amount exported from each U.S. PADD, but not the actual destination associated with those PADD-level exports.
U.S. petroleum exports have increased rapidly in recent years and have become an important factor in global oil markets. Increased access to U.S. oil exports data can provide valuable insight into global oil trade flows and allow new analysis of global oil markets.
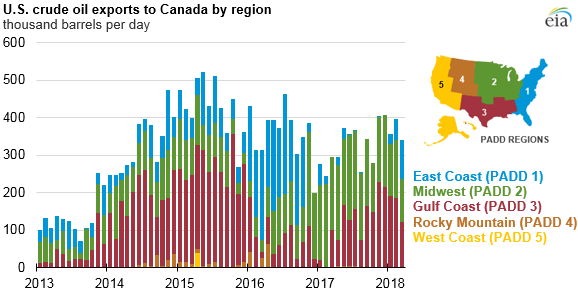
U.S. crude oil exports, in particular, have risen sharply since crude oil export restrictions were lifted in late 2015, reaching 1.1 million barrels per day (b/d) in 2017. Through June 15, 2018, U.S. crude oil exports have surpassed 2 million b/d seven times in EIA weekly data. Canada was the largest destination for U.S. crude oil exports in 2017, and with the addition of destination to PADD-level export data, EIA customers can now see that Canada receives U.S. crude oil primarily from the U.S. Midwest (PADD 2), the U.S. Gulf Coast (PADD 3), and the U.S. East Coast (PADD 1). In addition, changes in the relative amount of crude oil Canada received from each region over time can now be seen, notably the significant increase in exports from PADD 2 in 2017.
U.S. petroleum product exports have also increased over the past several years, reaching 5.2 million b/d in 2017. With the addition of destination to PADD-level export data, EIA customers can better track the seasonality that may exist in the exports of certain petroleum products. For example, distillate, the most exported petroleum product, is exported in larger volumes in the summer months, when U.S. consumption is at its seasonal low.
Distillate exports generally decline during the winter months, with exports from the East Coast, the main region that uses distillate (heating fuel) in the winter months, falling to nearly zero. However, during the winter in early 2017, warmer-than-normal weather and lower prices on the East Coast compared with those elsewhere in the Atlantic basin resulted in an unusually high amount of distillate exported from the East Coast for that time of year. By adding destination to PADD-level export data, it is now possible to see that the distillate was exported mainly to countries in Europe, along with some countries in Central and South America as well as Africa.

Note: The regional groupings above follow the regions defined in EIA’s International Energy Statistics. Export volumes to Eurasia were negligible and are not shown in the chart.
Users can also display and download this data by type of oil product and by U.S. region of export.
Principal contributor: Rebecca George