
Metered electricity demand in the New York ISO falls midday because of small-scale solar
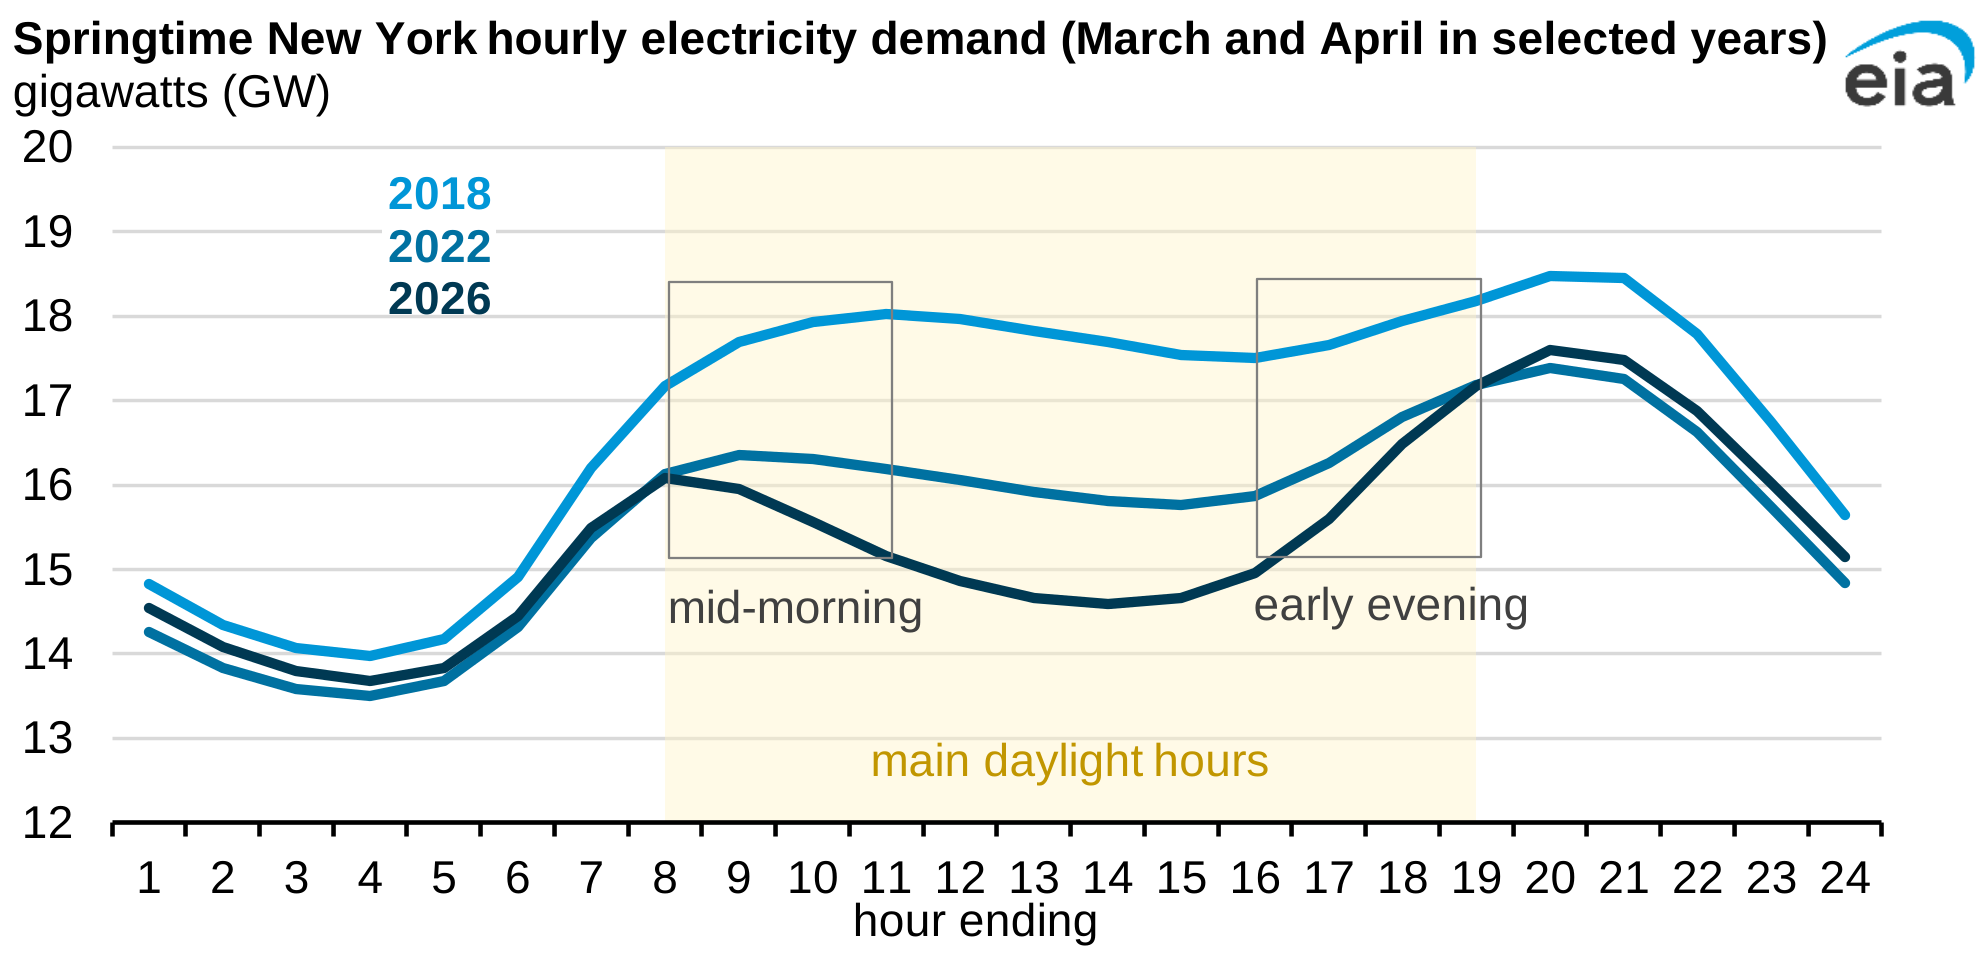
An increase in electricity generation from small-scale solar in New York has decreased the midday demand for metered electricity, amid overall declining load in the state. The trend is particularly notable in the early spring (March and April), when solar generation has an outsized impact because demand is relatively low and conditions for solar generation are favorable.
Rooftop and other photovoltaic (PV) systems with less than 1 megawatt (MW) of generating capacity are not typically metered by a utility. As this type of solar generating capacity has increased, midday demand on utilities has decreased, followed by a steeper increase in demand in the late afternoon and evening.
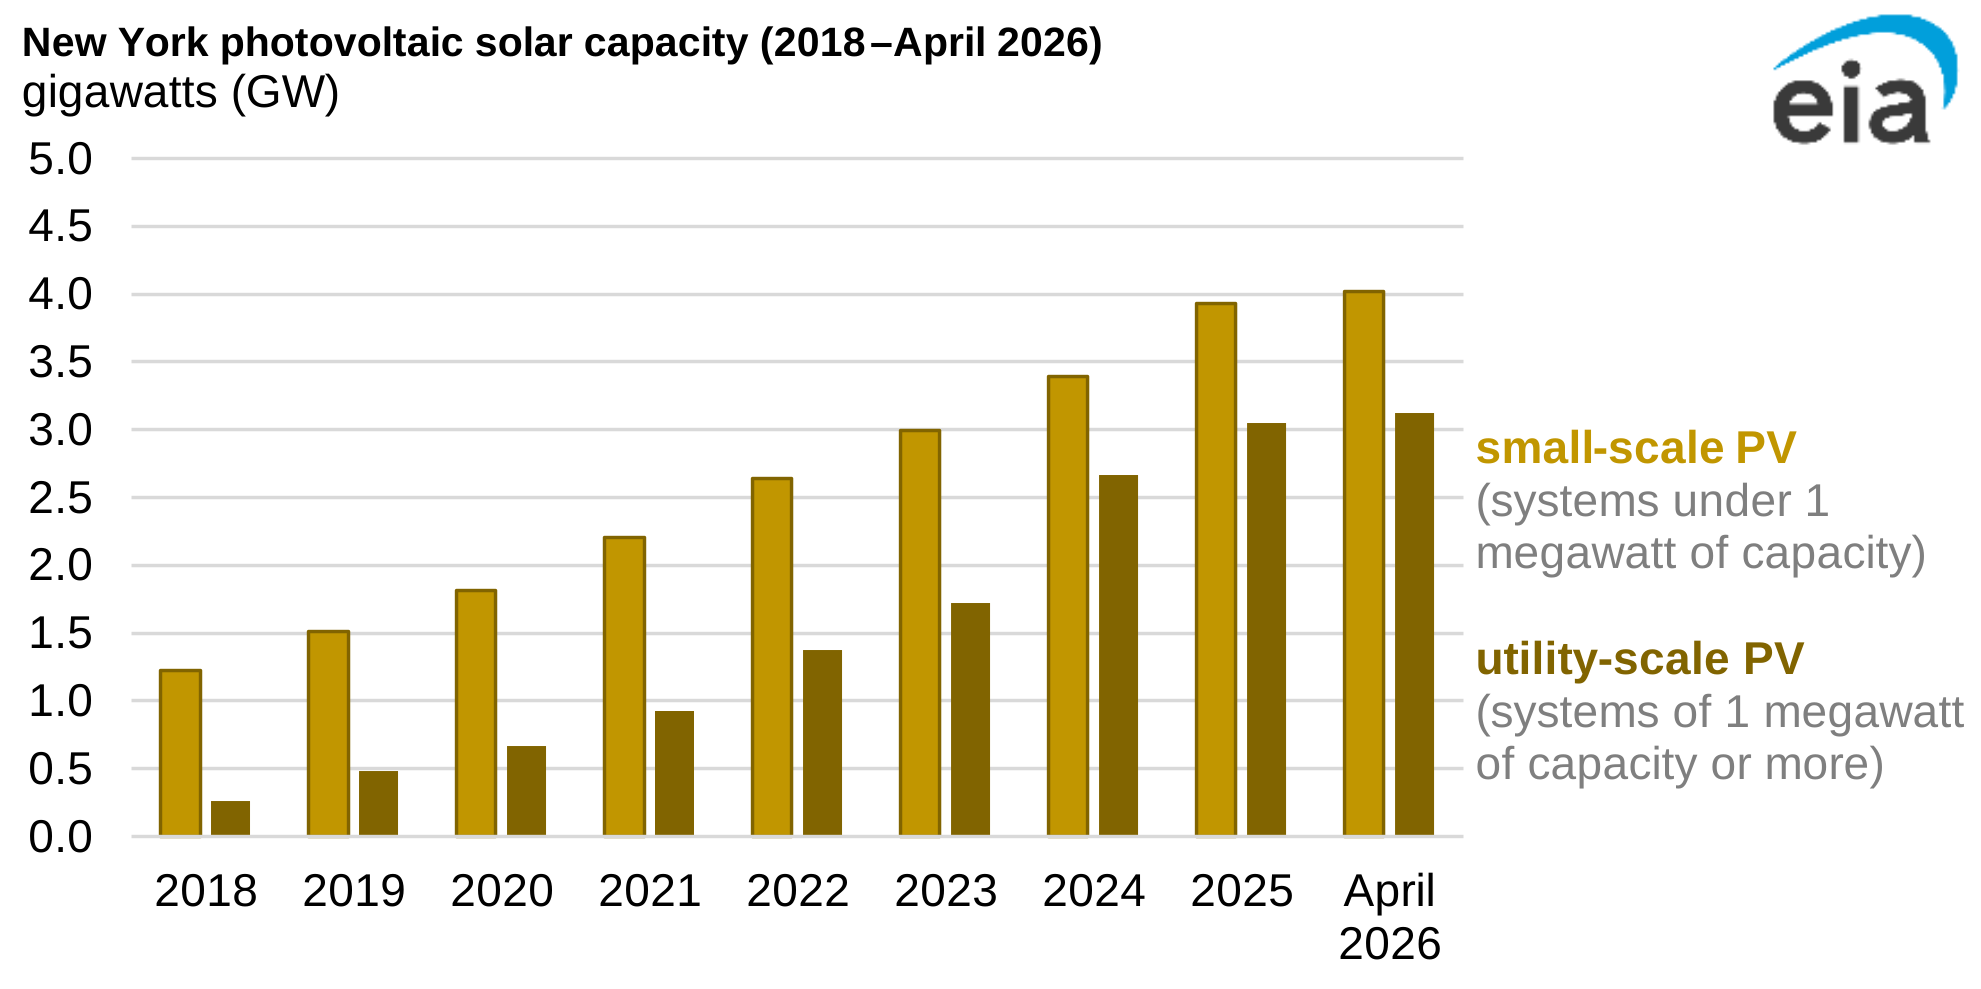
Total solar capacity in New York (small-scale and utility-scale) has increased by 5.6 gigawatts (GW) since 2018. Roughly half of the 5.6 GW of PV capacity additions have been small-scale solar. Because generation from small-scale solar is generally not metered by utilities, it is not distinguishable as a source of electricity generation on our Hourly Electric Grid Monitor; however, we assume it reduces electricity demand.
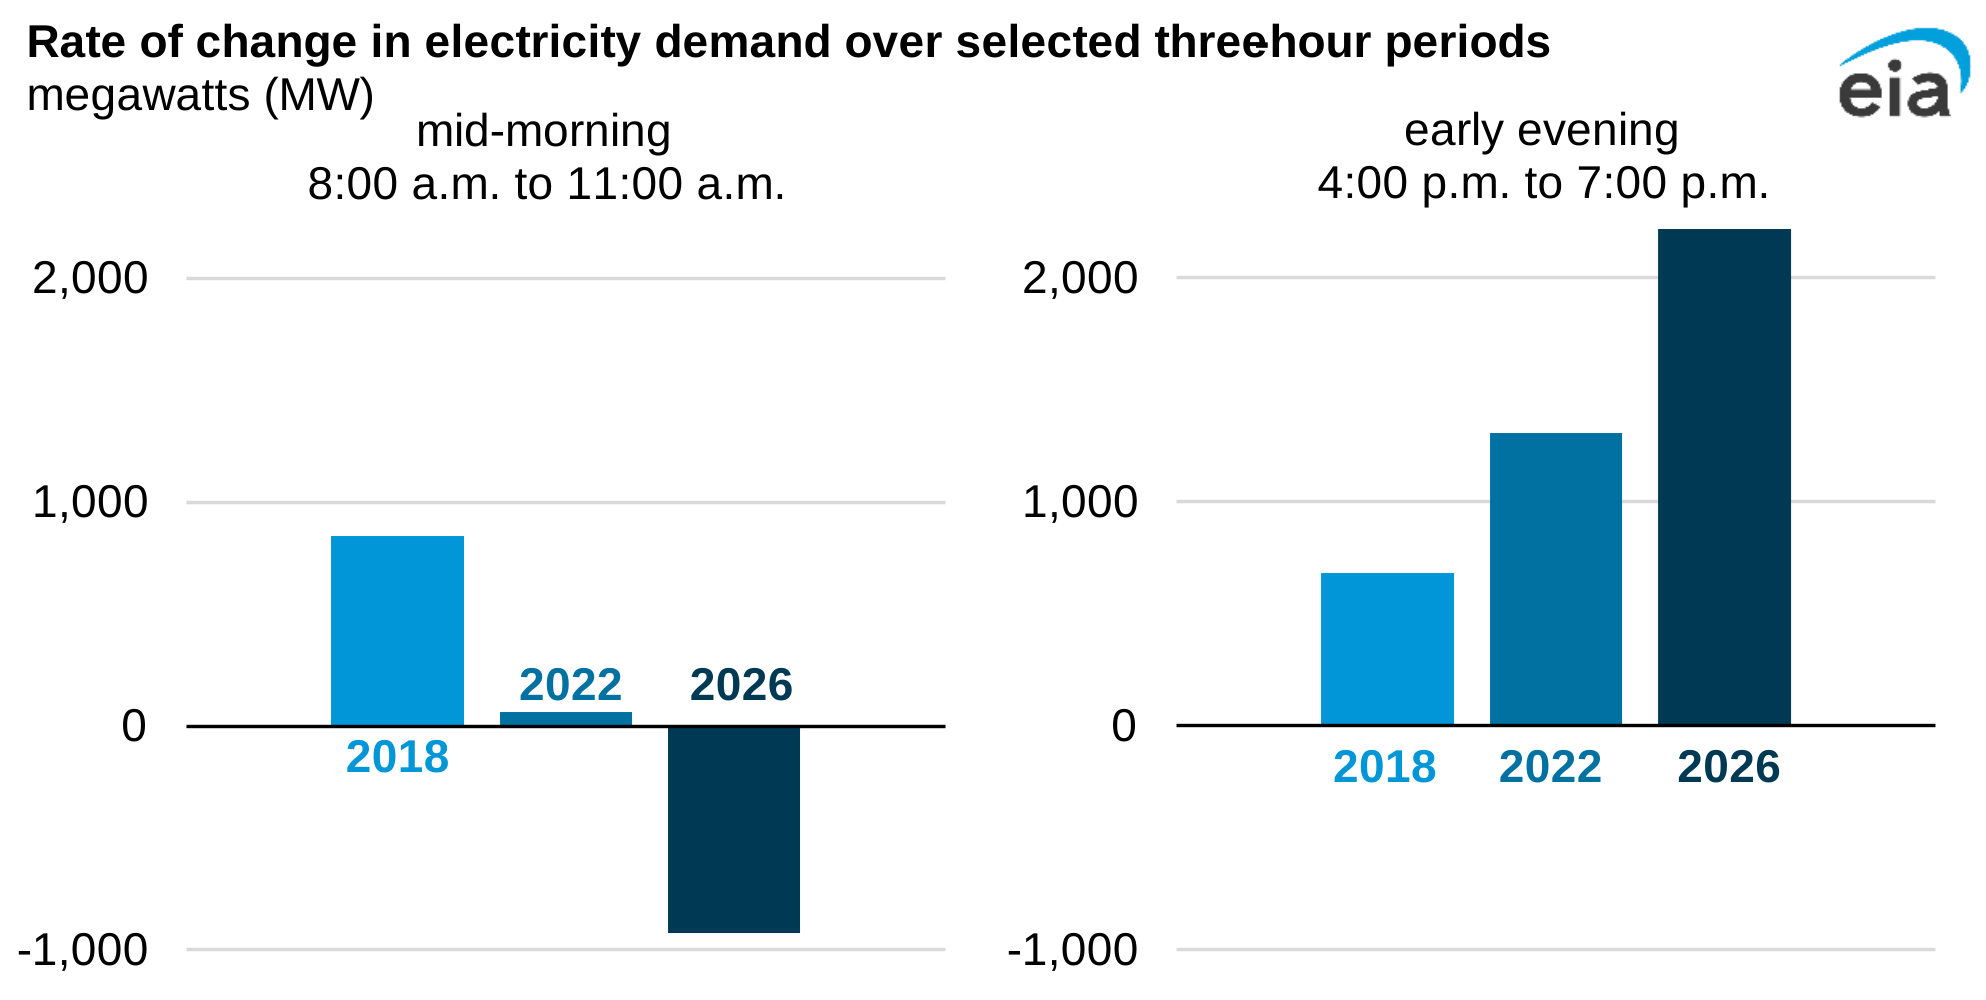
Electricity generally peaks twice a day, driven by consumption patterns in the residential sector. The first peak is in the morning when people wake up, and the second is in the evening when people return home. Historically, metered electricity demand would increase during both time periods. However, the addition of small-scale solar has altered the hourly rate of change of electricity demand in New York. Small-scale solar generation rapidly increases in the morning, resulting in less demand for metered electricity during that time of day than in years past. In the evening, generation from small scale solar decreases, resulting a sharper increase in metered electricity demand. Because utility grid operators generally dispatch solar generators first, they must ramp up or down other generation types to meet and balance electricity demand.
In March and April of 2018, hourly electricity demand in New York increased by an average of 850 MW during the three-hour period between 8:00 a.m. and 11:00 a.m. In 2026, electricity demand during that period decreased by an average a of 923 MW. Conversely, in March and April of 2018, early evening electricity demand increased by an average of 681 MW between 4:00 p.m. and 7:00 p.m. By 2026, electricity demand increased by an average of 2,221 MW during those three hours.
Principal contributor: Alex Felhofer
Tags: New York, electricity, solar