
U.S. wholesale day-ahead electricity prices rose in 2025 with higher natural gas prices
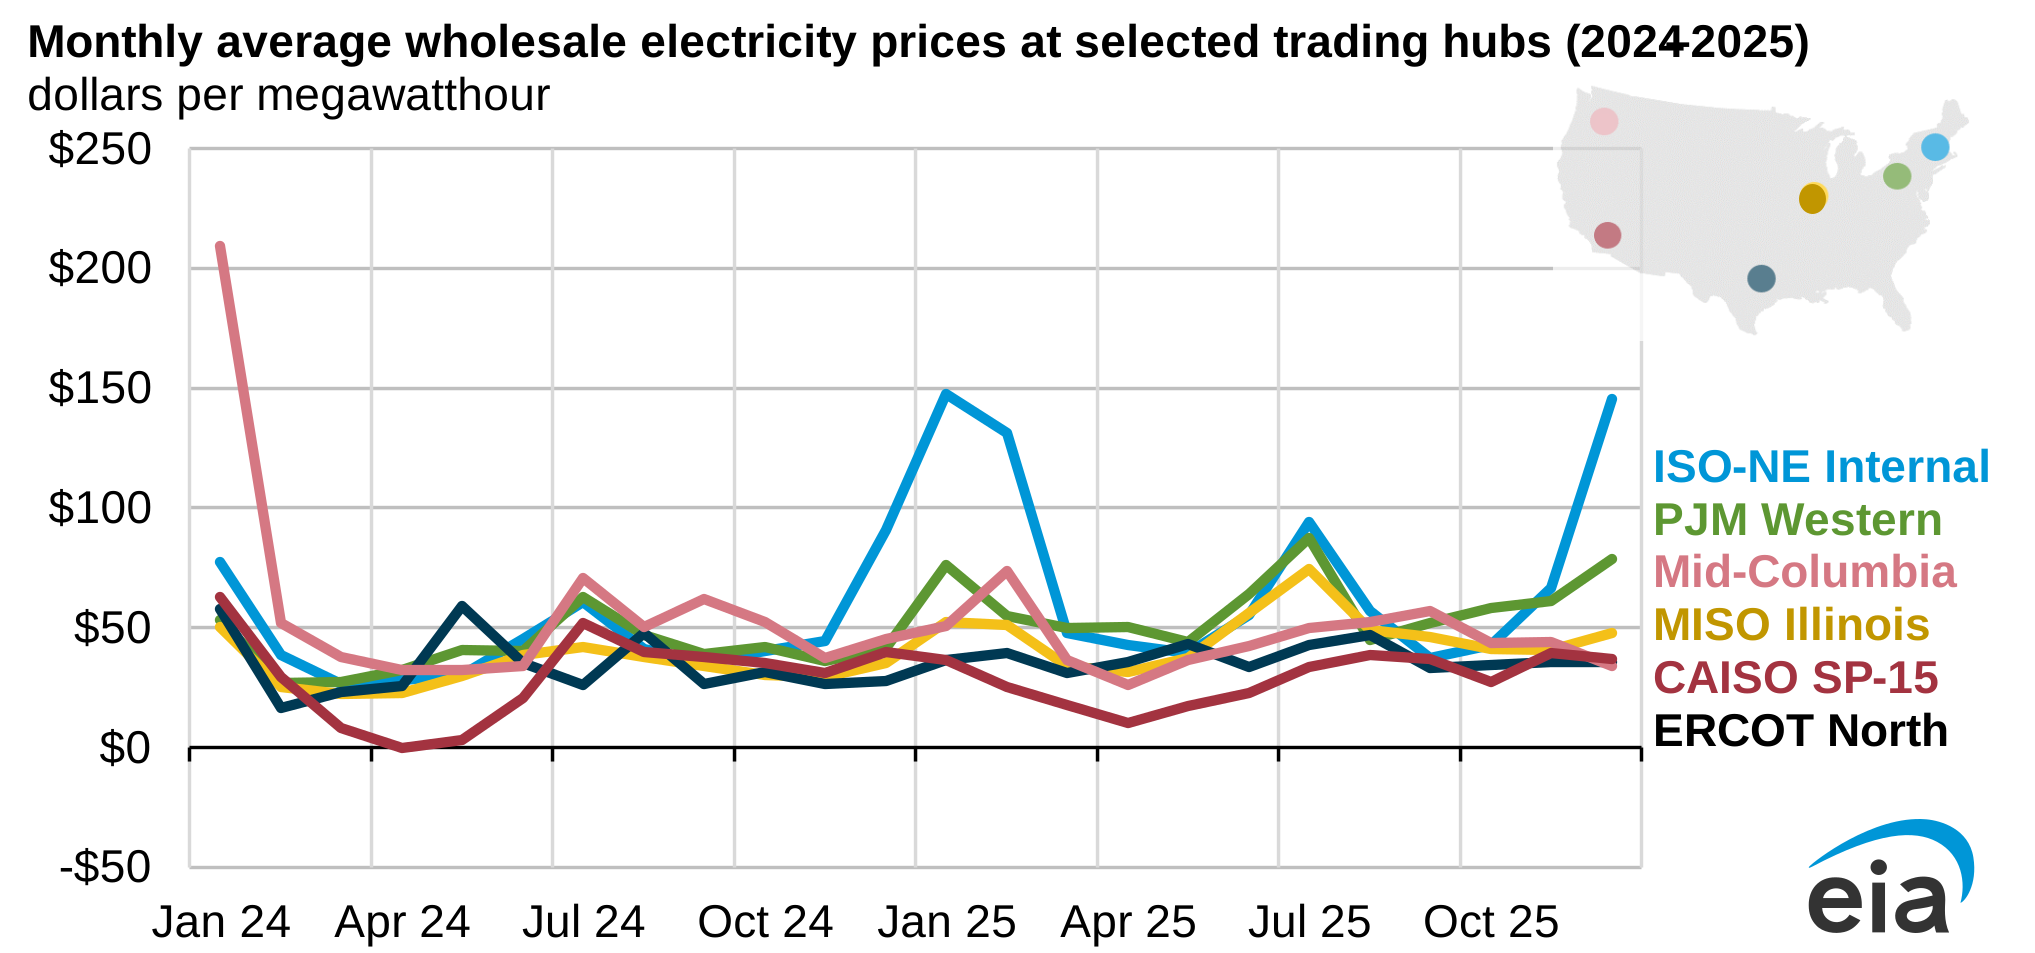
Average wholesale day-ahead electricity prices at most major trading hubs in the Lower 48 states were higher in 2025 than in 2024, driven largely by higher natural gas prices to electric generators. The largest increase in price was $29 per megawatthour (MWh) in New England’s Independent System Operator (ISO-NE), and the largest decrease was $14/MWh in the upper Northwest’s Mid-Columbia.
The wholesale price of electricity on the electric power grid reflects the day-ahead and real-time cost for supplying electricity, which can be driven by fluctuations in demand and fuel costs. Most retail customers pay prices based on the seasonal average cost of providing electricity and do not experience these daily price fluctuations. Price changes for natural gas have an outsized influence on wholesale electricity prices because natural gas prices set the marginal price of electricity during most hours in most regional markets.
Benchmark Henry Hub spot prices (Louisiana) averaged $3.52 per million British thermal units (MMBtu) in 2025, 56% more than in 2024, when prices were at inflation-adjusted record lows. Average natural gas prices at the Northeast hubs of Algonquin City Gate (Massachusetts) and Transco Zone 6 NY (New York) averaged twice as much in 2025 as in 2024.
Compared with 2024, electricity generation in the Lower 48 states increased by 2% in 2025, or 93 billion kilowatthours (BkWh), even though the year was one day shorter because of the leap year in 2024. Despite the increase in total electricity generation, natural gas-fired generation decreased 3% (53 BkWh) in 2025 because of higher natural gas prices. The decrease was more than offset by an 11% (76 BkWh) increase in less expensive coal-fired generation and a 32% (66 BkWh) increase in solar generation.
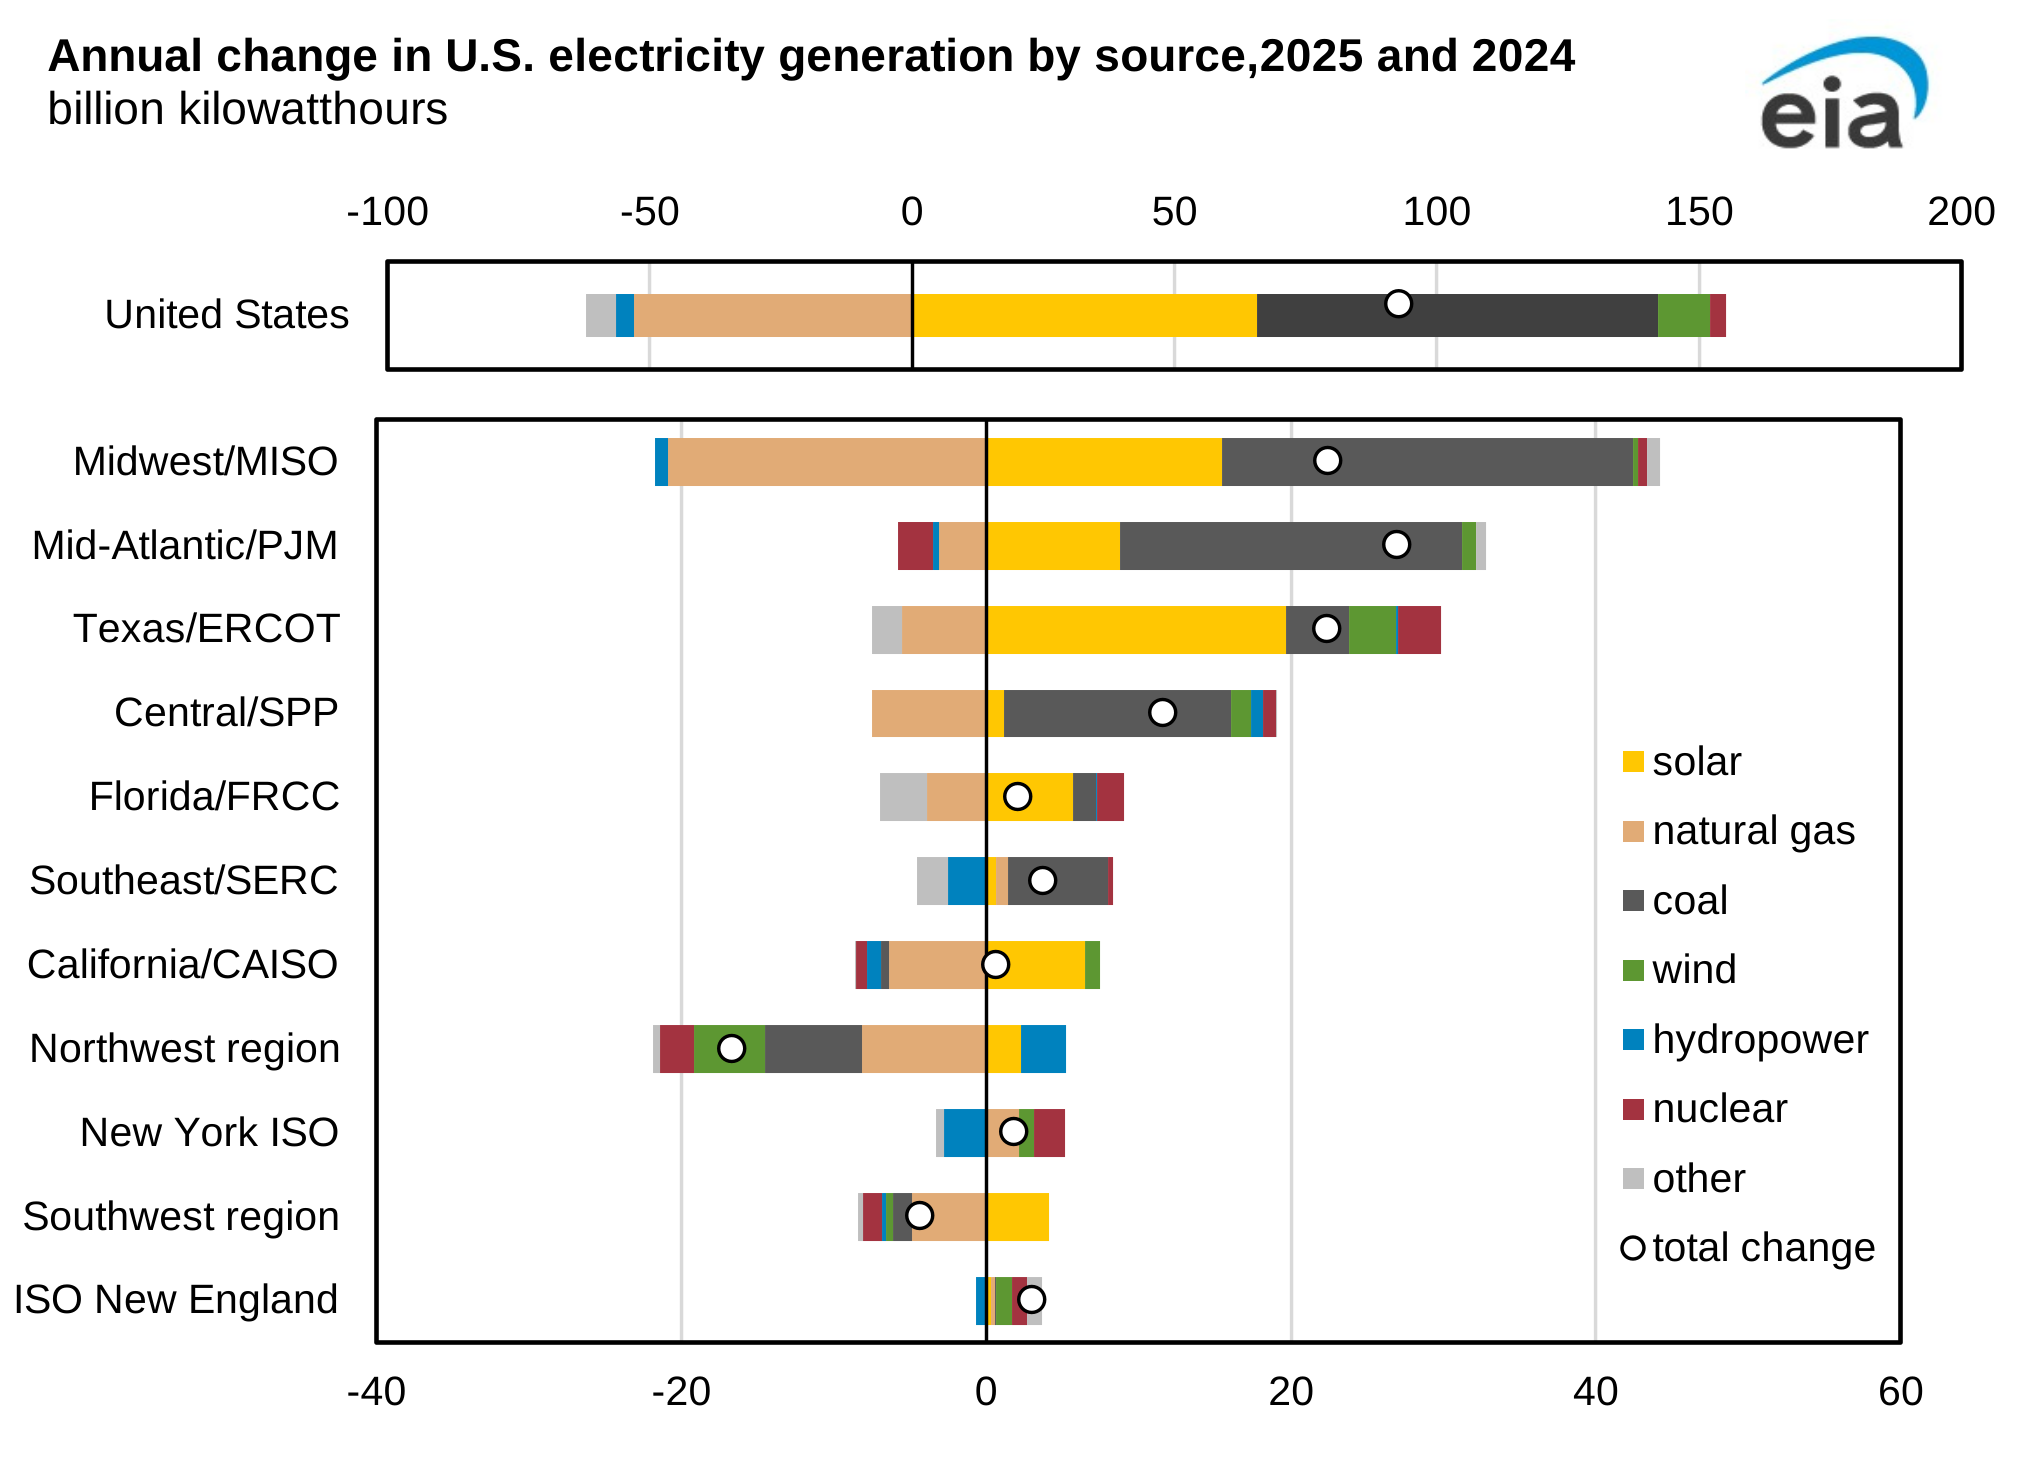
Although natural gas-fired generation decreased in most regions across the country in 2025 compared with 2024, the generation source that displaced it varied by region:
- In the Mid-Atlantic (PJM) and Midwest (MISO) regions, total generation increased 3% (49 BkWh), while natural gas generation decreased by 24 BkWh. Coal generation in the two regions increased 49 BkWh, and solar generation increased 24 BkWh.
- In Texas, where demand increased 5% (22 BkWh) in 2025 compared with 2024, solar generation increased by 20 BkWh, while natural gas generation decreased by 6 BkWh.
- In the Northwest, total generation decreased by 4% (17 BkWh) with a less severe winter in 2025 compared with 2024. Natural gas generation decreased the most (8 BkWh) even though natural gas prices to this region were at a historic low for a good part of the year. Nuclear generation decreased 22% (2 BkWh) after a 65-day refueling outage of the region’s only commercial nuclear generator. Hydropowered generation increased by 3 BkWh, while solar increased by 2 BkWh.
Principal contributor: Lori Aniti
Tags: wholesale prices, electricity, prices, natural gas