
Record U.S. natural gas demand this winter led to largest storage withdrawal in four years
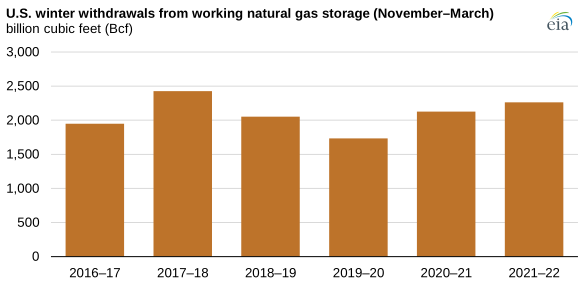
Net withdrawals of natural gas from U.S. storage totaled 2,264 billion cubic feet (Bcf) this winter (November through March). This amount is the most natural gas withdrawn from storage since the winter of 2017–18 and 10% more than the previous five-year (2016–17 to 2021–22) average, according to our recently released Natural Gas Monthly, which includes data through March 2022. Typically more natural gas is withdrawn from storage in the United States than is injected during the winter heating season as demand (including consumption and exports) exceeds supply (including production and imports). During the heating season, natural gas must be drawn from storage to meet this excess of demand over supply. Working U.S. natural gas storage levels at the end of March 2022 were 1,401 Bcf, which is 11 Bcf higher than March 2018.
On average, demand for natural gas in the United States exceeded supply by 14.9 billion cubic feet per day (Bcf/d) this past winter. Average U.S. supply and demand of natural gas both set record highs this past winter with supply at 104.3 Bcf/d and demand at 119.2 Bcf/d. U.S. natural gas supply and demand had been further out of balance during the winter of 2017–18, resulting in more natural gas withdrawn from storage that winter.
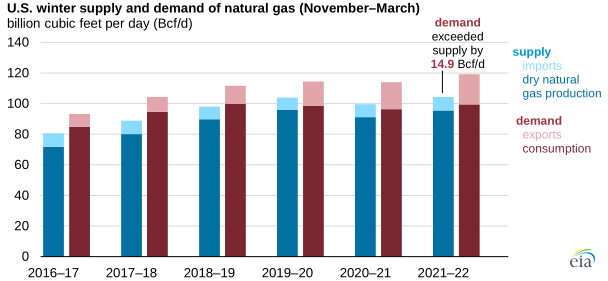
Production of dry natural gas increased in the United States last winter compared with the one before, averaging 95.6 Bcf/d, or close to the 2019–20 winter record of 96.0 Bcf/d. U.S. production has been generally increasing since 2020, after declining because of lower prices and reduced natural gas demand, but natural gas production during the winter did not reach its pre-COVID-19 pandemic level. Imports of natural gas also increased last winter compared with the one before, averaging 8.7 Bcf/d.
Consumption of natural gas grew in the United States to 99.5 Bcf/d last winter (0.4 Bcf/d less than the 2018–19 winter record) because of more natural gas consumption in the electric power sector. Natural gas consumed in the U.S. electric power sector rose by 2.0 Bcf/d compared with the previous winter (2020–21). In addition, a colder-than-normal January contributed to more U.S. natural gas storage withdrawals than average for that month. Total U.S. demand, including domestic consumption and exports, set a new record this winter, averaging 119.2 Bcf/d. A 2.0 Bcf/d rise in exports drove the growth, led by a 1.8 Bcf/d increase in liquefied natural gas exports.
Principal contributor: Corrina Ricker
Tags: consumption/demand, storage, natural gas, weather