
Natural gas combined-cycle plant use varies by region and age
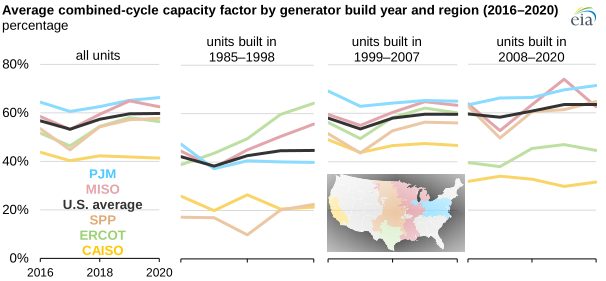
In recent years, U.S. natural gas combined-cycle (NGCC) electric generating capacity has increased as a result of relatively low natural gas prices and improved thermal efficiency and economies of scale from advances in turbine design. Newer turbines are more efficient than older turbine technologies, making them more cost-effective to run. As a result, the average annual capacity factor, or utilization rate, for newer NGCC generators in the United States is slightly higher than that of older, less efficient generators.
In 2020, the U.S. electric power sector added 5.8 gigawatts (GW) of combined-cycle generating capacity, bringing total U.S. NGCC capacity to 259.9 GW. As the U.S. generation mix has shifted away from coal and toward natural gas and renewables, the utilization rate of the U.S. NGCC fleet has risen steadily from an average of 35% in 2005 to more than 57% in 2020.
However, NGCC capacity factors vary significantly by region. Among NGCC units of all ages, generators located in the PJM Interconnection (PJM), which covers all or part of 13 states in the mid-Atlantic and Midwest, had the highest average capacity factor in 2020, at 66%. PJM is home to the Marcellus Shale, a deep natural gas reserve where natural gas production has grown rapidly.
Of the 51.1 GW of NGCC capacity operating in PJM, 52% came online between 2008 and 2020. These plants, which are the newest and, therefore, more likely to use advanced turbine technologies, had an average capacity factor of 71% in 2020, the highest across all regions and generator age groups.
The lowest average capacity factor for combined-cycle plants of all ages was in the California Independent System Operator (CAISO), at 41%, in 2020. Older units in the state had the lowest average capacity factor, at 21%, in 2020, but the average capacity factor for plants put into service between 2008 and 2020 in CAISO was also low, at 32%.
Although newer plants tend to be run at higher rates than older plants, market conditions in some regions can affect how often newer plants are run, such as in CAISO. New plants may be run less often if they are built in areas where market conditions suddenly shift toward higher renewable or other alternative generation, where local natural gas prices are high, or where electric transmission grid congestion affects the zones where the plants are located.
Principal contributor: Augustine Kwon
Tags: generation, electricity, natural gas, power plants