
Retail gasoline prices in California decline from recent highs
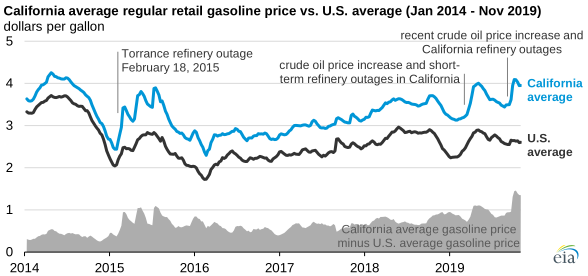
On October 7, 2019, the average California regular retail gasoline price surpassed $4 per gallon (gal) for only the second time since 2014, according to the U.S. Energy Information Administration’s (EIA) Gasoline and Diesel Fuel Update. Prices remained above $4/gal for three weeks, but prices have since fallen to $3.95/gal on October 28 and November 4.
The last time prices reached $4/gal was in May 2019, which was a result of planned and unplanned refinery outages in California. California’s petroleum markets are isolated from the rest of the United States because of California's lack of petroleum infrastructure connections to the rest of the country, so unplanned refinery outages in the state can have larger price impacts than in other areas of the country. In addition, California requires a different gasoline specification than the rest of the country, further narrowing supply options.
The spike in crude oil prices following the September 14 attacks in Saudi Arabia on crude oil infrastructure led to a small, short-lived gasoline price increase across the United States, followed by several unplanned refinery outages in California. The refinery outages further raised gasoline prices in the state even though average U.S. gasoline prices declined.
On October 14, 2019, the price for retail gasoline in California averaged $1.46/gal more than the U.S. average retail gasoline price (the price premium), the largest price difference since at least May 2000, when EIA began collecting California gasoline price data. On September 30, 2019, California gasoline price premiums reached $1.31/gal, surpassing those seen during the Torrance refinery outage in 2015 ($1.10/gal) and the refinery outages that occurred earlier in 2019 ($1.11/gal). The recent price spike appears to be short-lived, similar to the price spike in May, and the price premium for gasoline in California declined to $1.35/gal on October 28 as refiners resumed normal operations and gasoline supply increased.
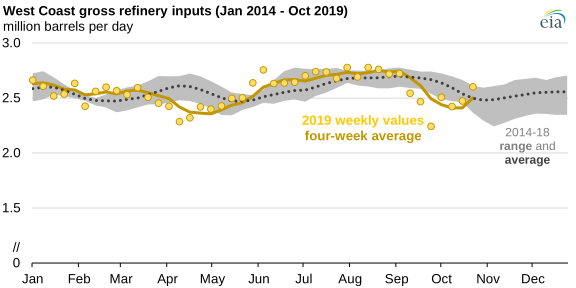
Shortly after the crude oil price spike following the attacks in Saudi Arabia, several refineries in California went down for both planned and unplanned maintenance. As a result, West Coast refinery utilization fell from 95% to 78% between September 6 and September 27, which happened at the same time that gross inputs into West Coast refineries decreased from 2.7 million barrels per day (b/d) to 2.2 million b/d, the largest decline during a three-week period since at least 1995. Gross refinery inputs increased during the next several weeks as maintenance was completed.
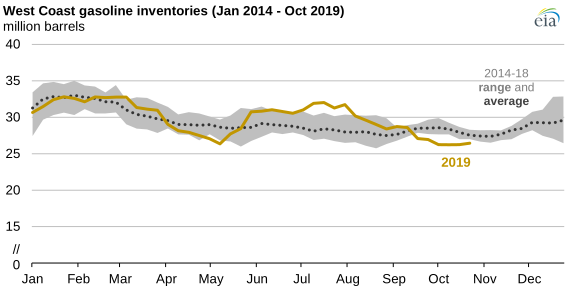
The most readily available source of gasoline supply in California is from local inventories, and as gross refinery inputs fell from September 6 to September 27, the total West Coast gasoline inventories fell 1.8 million barrels to 27.0 million barrels. As refineries resumed operation, total inventories continued to decline, falling to 26.2 million barrels on October 11, 2.2 million barrels lower than the previous five-year average, before increasing to 26.4 million barrels on October 25.
Because of the unique product specifications and long distance from international gasoline markets, California does not typically import much gasoline. However, after drawing down local inventories, higher gasoline prices following refinery outages covered the costs for gasoline imports. West Coast gasoline imports reached 191,000 b/d the week of October 25, while the four-week moving average reached 70,000 b/d compared with an annual average of 23,000 b/d in 2018.
Principal contributor: Matt French
Tags: prices, gasoline, liquid fuels, California, oil/petroleum, states