
Wind expected to surpass hydro as largest renewable electricity generation source
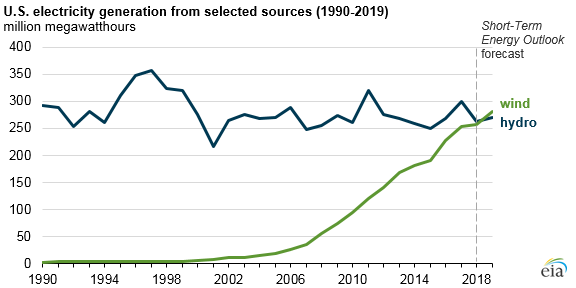
Updated February 15, 2018, at 10:30 a.m. to correct the units in the first figure.
As one of the first technologies used to generate electricity, hydroelectric power has historically provided the largest share of renewable electricity generation in the United States. However, this year EIA expects wind power to surpass hydroelectricity, based on forecasts in the latest Short-Term Energy Outlook. Different factors lead to uncertainty about the forecast level of electricity generation from each energy source.
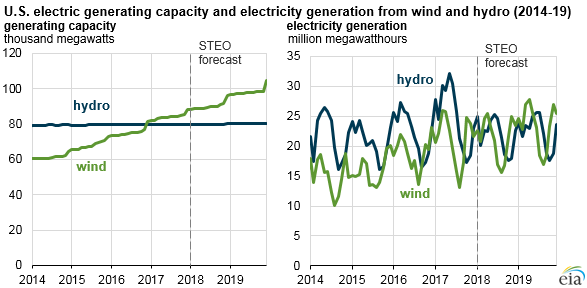
Because few new hydro plants are expected to come online in the next two years, hydroelectric generation in 2018 and 2019 will largely depend on precipitation and water runoff. Although changes in weather patterns also affect wind generation, the forecast for wind power output is more dependent on the capacity and timing of new wind turbines coming online.
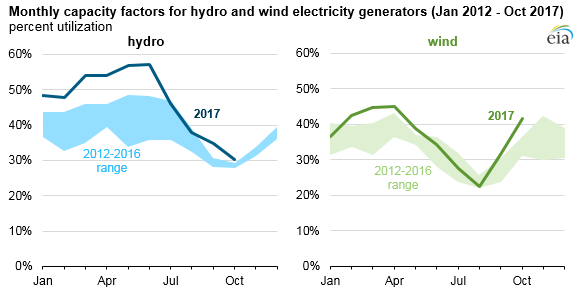
Both hydro and wind generation follow seasonal patterns. Hydro generation is typically highest in the spring when precipitation and melting snowpack increase water runoff. Wind generation is typically highest in the spring and fall, reflecting the capacity-weighted mix of seasonal patterns in wind across the country. Hydro often has slightly higher annual capacity factors, or utilization rates, averaging 38% in 2016 compared with wind’s 35%.
EIA’s hydroelectric generation forecasts over the next two years are mostly based on projections of water runoff. After a relatively wet year in 2017—when hydro provided 7.4% of total utility-scale generation—hydro generation is expected to be slightly lower at 6.5% of total utility-scale generation in 2018 and 6.6% in 2019.
EIA expects significant levels of new wind capacity to come online in 2018 and 2019, similar to the trend in recent years. EIA’s most recent Preliminary Monthly Electric Generator Inventory survey shows wind capacity increasing by 8.3 gigawatts (GW) in 2018 and 8.0 GW in 2019. If these new generating units come online as scheduled, they would add 9% to U.S. utility-scale wind capacity by the end of 2018 and another 8% by the end of 2019.
Because much of the new electric capacity comes online in the final months of each year, these capacity additions affect the subsequent year’s electricity generation values. EIA expects wind to provide 6.4% and 6.9% of total utility-scale electricity generation in the United States in 2018 and 2019, respectively, up from 6.3% in 2017.
Principal contributor: Owen Comstock
Tags: electricity, generation, hydroelectric, renewables, wind