
U.S. petroleum refinery capacity continues to increase
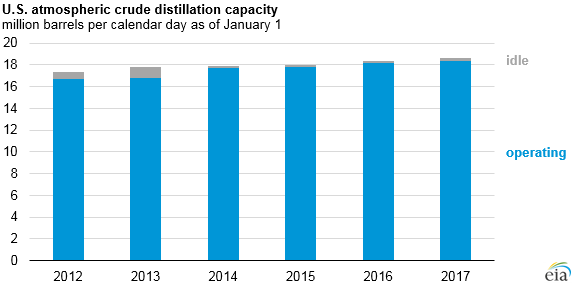
As of January 1, 2017, U.S. operable atmospheric crude distillation capacity reached 18.6 million barrels per calendar day (b/cd), 1.6% higher than at the beginning of 2016, according to EIA's annual Refinery Capacity Report. This increase in operable capacity was slightly lower than last year’s increase of 2.0%.
The capacities of secondary units that support heavy crude oil processing and production of ultra-low sulfur diesel and gasoline, including thermal cracking (coking), catalytic hydrocracking, and hydrotreating/desulfurization, also increased. Catalytic hydrocracking and deasphalting units experienced the largest capacity increases over the past year, rising by 4.5% and 6.1%, respectively.
EIA's Refinery Capacity Report measures refinery capacity in b/cd and barrels per stream day (b/sd). Calendar-day capacity is a measure of the amount of input that a distillation unit can process in a 24-hour period under usual operating conditions, taking into account both planned and unplanned maintenance. Stream-day capacity is the maximum number of barrels of input that a distillation facility can process within a 24-hour period when running at full capacity under optimal conditions with no allowance for downtime. Stream-day capacity has historically been 6% higher than calendar-day capacity.
The refinery capacity reported for the start of 2017 includes one new unit, the 42,500 b/cd Magellan Midstream Partners LP condensate splitter in Corpus Christi, Texas. Condensate splitters are distillation units that process condensate, which is lighter than crude oil. Splitter capacity is categorized as atmospheric distillation units in EIA data. The Magellan Midstream Partners LP unit, which began operating in 2017, was operable but not running at the start of the year, so its capacity was listed as idle in the Refinery Capacity Report. Overall, the percent of idle distillation capacity as of January 1 was 1.6%, a slight increase from last year’s relatively low 0.8%.
Gross inputs to refineries, also referred to as refinery runs, averaged a record-high 16.5 million barrels per day (b/d) in 2016. U.S. crude oil production was 0.5 million b/d lower in 2016 than in 2015, the first annual decline since 2008. To offset the decline in production, net imports of crude oil increased by a similar amount. Despite the increase in refinery runs, atmospheric crude distillation capacity increased even more, lowering refinery utilization in 2016 compared with 2015.

Principal contributors: Corrina Ricker, Julie Harris