
EIA expects lower natural gas production in 2020
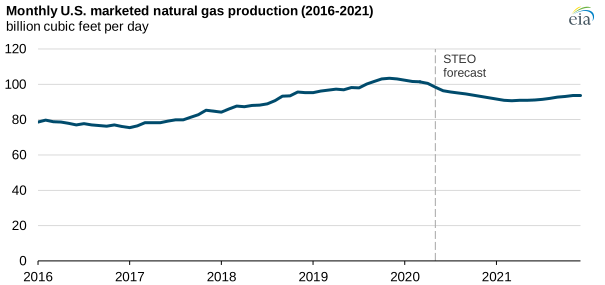
Updated May 18, 2020 at 10:30 a.m. to revise the forecasted change in production and Henry Hub prices. EIA currently forecasts U.S. natural gas production to average 97.1 Bcf/d in 2020, 2% lower than the 2019 average. A previous version stated the 2020 forecast as 94.3 Bcf/d, or 5% lower than the 2019 average. Corrections to the Henry Hub price were relatively minor. Text and figures have been updated accordingly.
In its May 2020 Short-Term Energy Outlook (STEO), the U.S. Energy Information Administration (EIA) forecasts that U.S. marketed natural gas production will decrease by 2% in 2020 because of a weakening economic outlook from the impact of efforts to reduce the spread of the 2019 novel coronavirus disease (COVID-19). EIA expects U.S. marketed natural gas production to average 97.1 billion cubic feet per day (Bcf/d) in 2020, down from 99.2 Bcf/d in 2019.
Before the economic contraction caused by mitigation efforts in response to COVID-19, EIA expected natural gas production would flatten in 2020 because of the oversupplied market created as natural gas production growth has outpaced demand growth. The United States set annual natural gas production records in 2018 and 2019, largely because of the increase in drilling in shale and tight oil formations. This increase in production led to higher volumes of natural gas in storage and a decrease in natural gas prices.
Declines in crude oil and natural gas prices in March and April have led producers to announce plans to further reduce capital spending and drilling levels, as well as curtail production from some existing wells. Most of the expected decline in natural gas production is from associated gas in oil-directed plays, particularly in the Permian Basin that spans parts of western Texas and eastern New Mexico.
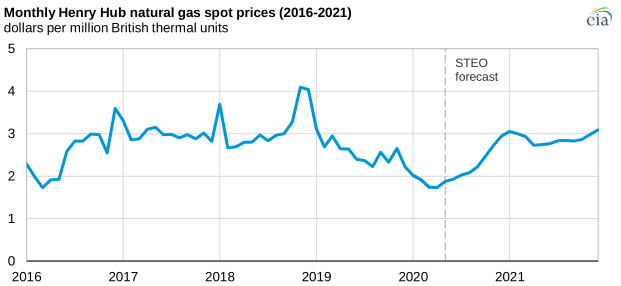
EIA expects that the natural gas spot price for the U.S. benchmark Henry Hub will average $2.14 per million British thermal units (MMBtu) in 2020, 43 cents lower than the 2019 average of $2.57/MMBtu. Natural gas prices were already decreasing earlier this year because of the previous year’s record production level and a warmer-than-normal winter. In part because of reduced business activity and higher-than-average storage levels before the summer, Henry Hub prices fell to an average of $1.74/MMBtu in April 2020, the lowest monthly average since March 2016.
EIA expects natural gas prices to increase starting in the third quarter of 2020, driven by an increase in industrial demand as business activity resumes. Projected natural gas prices rise to an average of $2.89/MMBtu in 2021 because of upward pricing pressure from declining growth in natural gas production.
Principal contributors: Kirby Lawrence, Emily Geary, Troy Cook