
Thanksgiving and Black Friday have unique electricity demand patterns
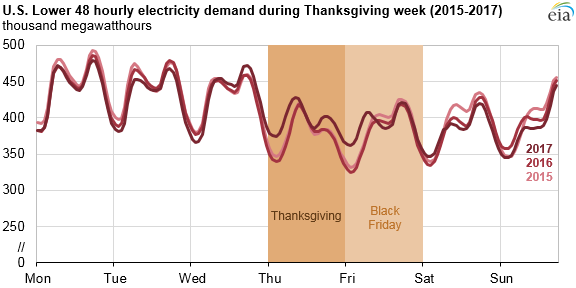
Hourly electricity usage on Thanksgiving and the following day (Black Friday) tend to have different demand patterns from other weekdays. On a typical weekday in November, electricity usage tends to have two peaks: a morning peak and a slightly higher evening peak. On Thanksgiving, electricity demand tends to be highest late morning, as families cook meals and gather to celebrate the holiday. And because most businesses are closed, overall electricity demand on Thanksgiving Day tends to be lower.
Peaks in electricity demand result from simultaneous electricity usage in the residential and commercial sectors. Typical weekdays have two demand peaks—one in the morning and one in the evening—as electricity is used to meet lighting and space conditioning demands. The morning peak reflects the timing of most Americans waking up and going to work, while the reverse is true in the evenings, as households use electricity to heat their homes, prepare food, or watch television.
Weekend days tend to have different electricity usage patterns, as the total demand is typically much lower than on a weekday. Unlike most Fridays, Black Friday’s electricity demand closely resembles weekend electricity demand patterns. EIA’s U.S. Electric System Operating Data page provides hourly electricity demand for the Lower 48 states, several subregions, and more than 60 individual balancing authorities, allowing analysts to see how electricity demand changes over time and across geographies.
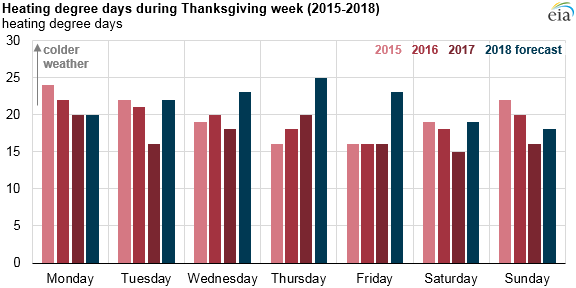
Differences in Thanksgiving electricity demand over the past few years are usually attributable to weather. In 2017, households in many Midwestern and Northeastern states experienced below-normal temperatures on Thanksgiving. Heating degree days are a temperature-based proxy for heating demand, representing differences from 65 degrees Fahrenheit. Although not all homes use electricity as their primary heating fuel, many homes use electricity as a secondary heating fuel.
During the week of Thanksgiving 2017, heating degree days ranged from 15 to 20 for the Lower 48 states, meaning—on a population-weighted average basis—temperatures were in the range of 45 to 50 degrees Fahrenheit. Heating degree days for Thanksgiving week 2018 are expected to be 150, or 24% more than last year, based on forecasts from the National Oceanic and Atmospheric Administration.
Principal contributor: Michelle Bowman