
Average U.S. construction costs for solar and wind continued to fall in 2016
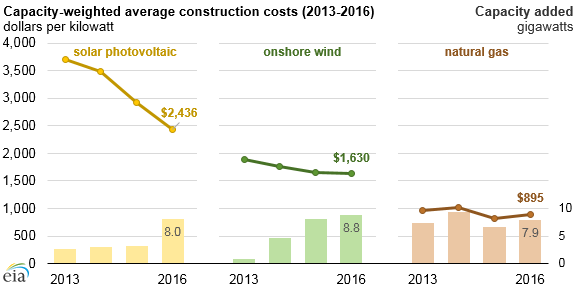
Based on 2016 EIA data for newly constructed utility-scale electric generators (those with a capacity greater than one megawatt) in the United States, annual capacity-weighted average construction costs for solar photovoltaic systems and onshore wind turbines declined, while construction costs for natural gas generators increased slightly. These three technologies accounted for about 93% of total electric generating capacity added in 2016. Across the United States, investment in electric generating capacity in 2016 increased more than 50% from 2015.
Solar: The cost of construction for solar photovoltaic (PV) projects has steadily decreased since EIA began collecting data in 2013. Average construction costs reached $2,436 per kilowatt (kW) in 2016, down from $3,705/kW in 2013. Nearly 500 PV generating units totaling 8 gigawatts (GW) were added to the electric grid in 2016, making it the second-most common technology installed in 2016, after wind turbines.
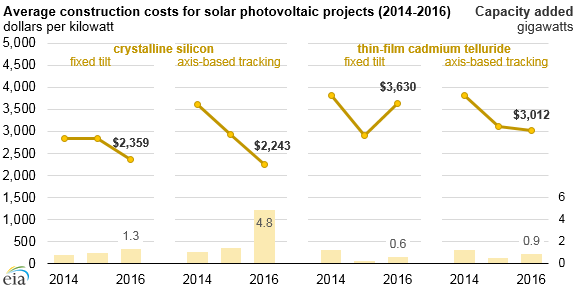
Solar PV systems vary by the type of panel used and whether the system uses tracking technology. In 2016, crystalline silicon solar PV systems with tracking were the most-added solar technology and the least expensive, at $2,243/kW.
Crystalline silicon has become the most widely used photovoltaic technology as the technology has matured and construction cost have dropped. Its installed costs declined $400-$500/kW per year to $1,000/kW lower than that of thin film as a result of demand and economies of scale.
Between 2013 and 2015, fixed-tilt mounting systems cost less than axis-based tracking systems, but in 2016, axis-based tracking systems cost less. This change was likely attributable in part to the typical system sizes associated with axis-based systems, because economies of scale allow larger axis-based tracking systems to have a lower capacity-weighted average cost than smaller fixed-tilt systems.
The effect of U.S. tariffs, approved in early 2018, on imported silicon solar cells and modules on future solar photovoltaic costs is unknown. Solar cells are the individual units or wafers that convert sunlight directly into electricity, and a collection of interconnected cells in a sealed package is referred to as a module or panel. Solar panels are installed in arrays, or rows of panels, that—along with other hardware such as an inverter—make up an installation.
Wind: Utilities added 84 wind turbine projects, totaling 8.8 GW, to the electric grid in 2016. The construction costs for onshore wind generators in 2016 reached $1,630/kW, a slight decrease from 2015.
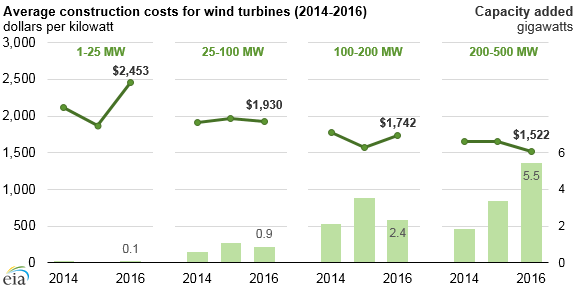
Capacity-weighted costs tend to be lower for larger wind plants. In the past three years, most new wind capacity has been larger plants—89% of 2016 wind turbine additions were to sites with more than 100 megawatts. As the capacity added at a site increases, the capacity-weighted construction cost decreases because the siting and infrastructure costs are shared by more turbines and capacity.
Wind class—the wind speeds for which a wind turbine is optimized—can also affect wind generator costs; wind turbines designed for high- and medium-speed winds (classes 1 and 2) averaged about $100/kW more than turbines designed for low wind (class 3).
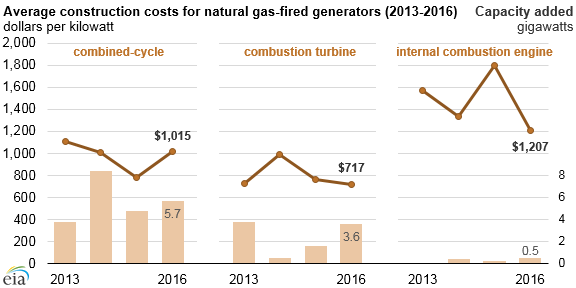
Natural Gas: In 2016, 100 natural gas-fired generators, totaling 9.8 GW, were added to the electric grid. Costs averaged $895/kW, an increase from $812/kW in 2015. Of the 9.8 GW added, 3.6 GW were combustion turbines. Combustion turbines are the least expensive natural gas generating technology, and a large amount of combustion turbine capacity was added in 2016—more than twice what was added in 2015.
Even though combustion turbines have lower capital costs than combined-cycle systems, the improved efficiency of combined-cycle systems may make them more economically attractive. A total of 5.7 GW of combined-cycle capacity was added in 2016, despite capital costs nearly $300/kW higher than combustion turbines.
Principal contributor: Ray Chen
Tags: costs, electricity, natural gas, generating capacity, renewables, wind, power plants, solar