
Coal remains competitive for power generation in the central United States
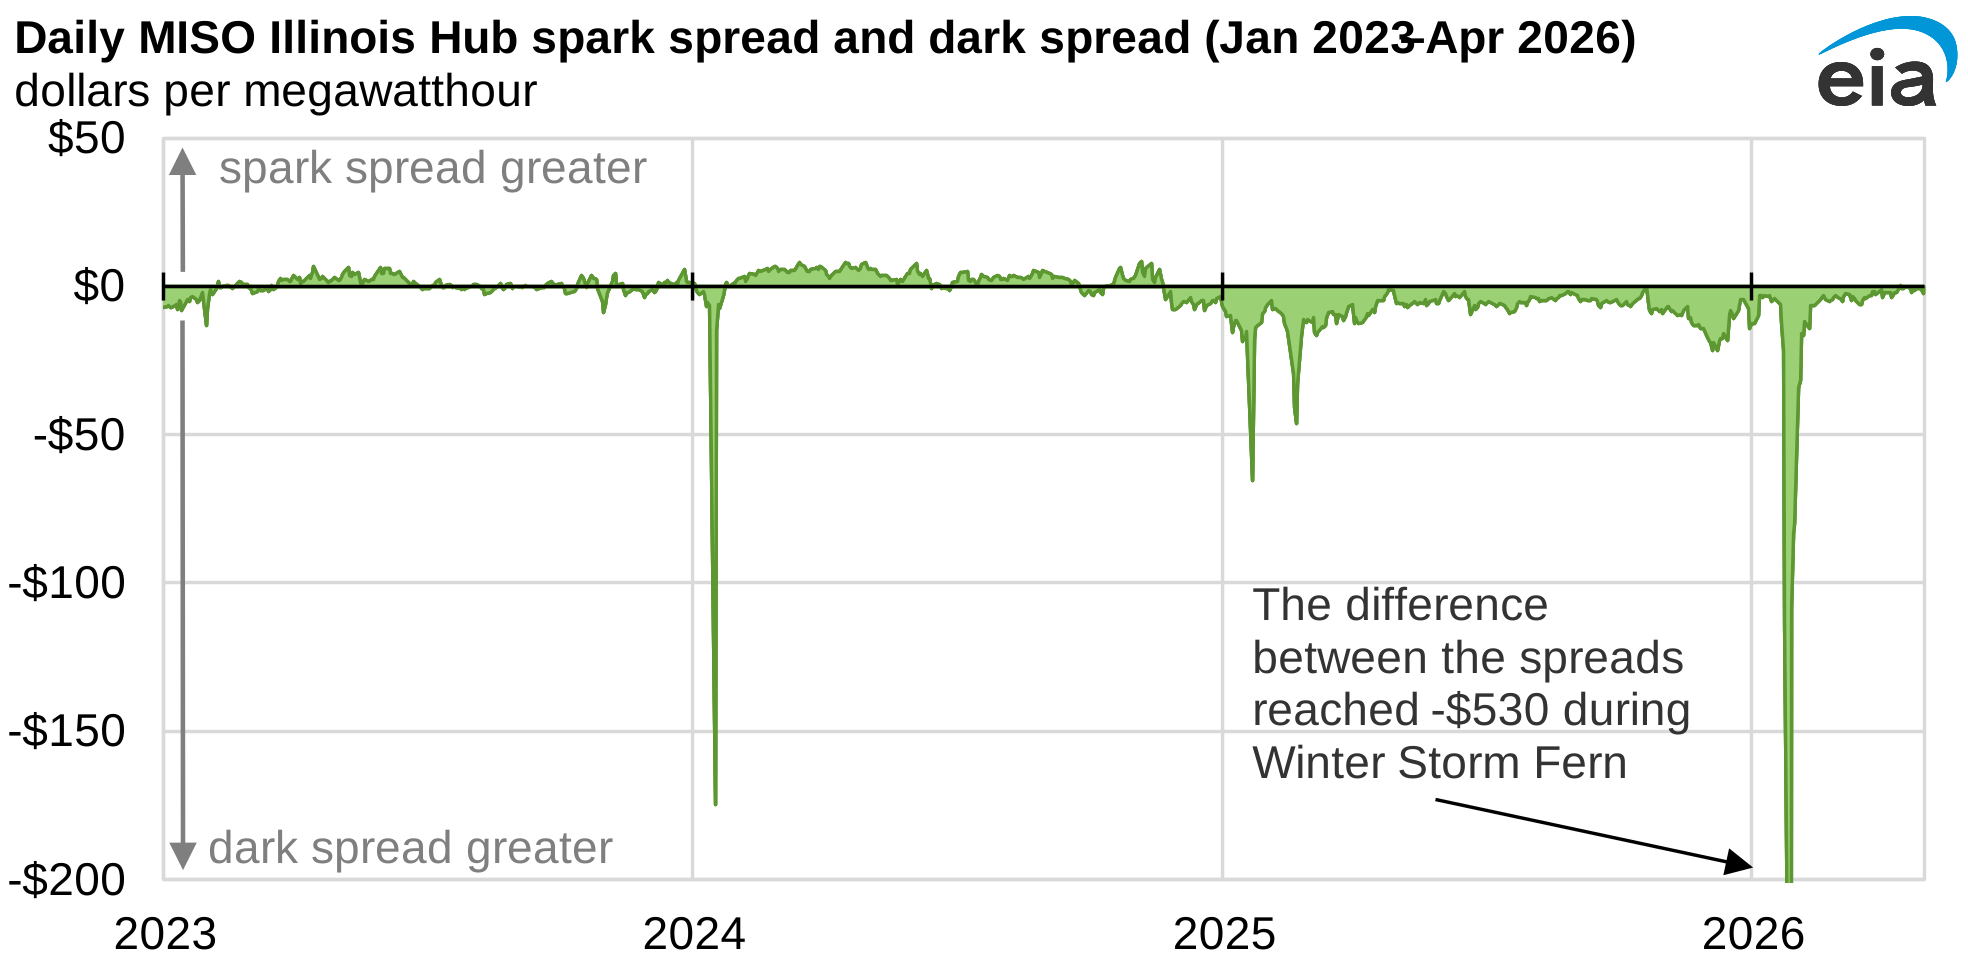
Note: The specifics of the calculation methodology are detailed in our 2017 Today in Energy article, with minor adjustments to heat rates and heat contents used. The heat rate used for the dark spread was 10,579 British thermal units per kilowatthour (Btu/kWh) while the heat rate for the spark spread was 8,365 Btu/kWh.
In the first four months of 2026, electricity, natural gas, and coal prices suggested continued favorable economics for coal generation in MISO. The dark spread of coal, the difference between the fuel costs for coal-fired generation and the wholesale electricity price, in the Midcontinent Independent System Operator (MISO) region outpaced a similar measure of revenue relative to fuel costs for natural gas-fired generators known as the spark spread.
The difference between the dark and spark spreads, both indicators of profitability, reached $530 per megawatthour (MWh) during Winter Storm Fern in January.
Beginning in late 2024, the dark spread in MISO began to be consistently larger than the spark spread. In 2025, the dark spread increased 111% compared with 2024 as the price for electricity increased faster than the cost to generate electricity from coal. The spark spread, however, increased at a slower rate, 18%, because rising costs for natural gas generation offset increasing electricity prices.
From 2024 to 2025, the average electricity price in MISO increased 44%. Over the same period, coal prices increased only 3%, and the dark spread increased from $11/MWh to $23/MWh. Natural gas prices increased 63% from 2024 to 2025, offsetting the increase in electricity prices, and the spark spread increase was limited to $2/MWh, increasing from $12/MWh in 2024 to $14/MWh in 2025.
During Winter Storm Fern, there were large divergences between dark and spark spreads for six consecutive days. Daily average power prices in MISO rose to exceptionally high levels—exceeding $260/MWh from January 26 to January 28—even though electricity demand during those six days was 11% lower than during the same weekday period before the storm. The elevated electricity prices were driven primarily by spikes in natural gas prices. Heating demand during the storm pushed natural gas prices sharply higher, increasing from $25/MWh on January 20 to $549/MWh by January 27. Coal prices, however, are far less sensitive to daily fluctuations in demand. Natural gas purchased on the spot market can be delivered almost immediately because most natural gas-fired power plants are connected to pipeline infrastructure, but coal purchased on the spot market requires a lead time for delivery, often about one month, because it must be transported to the power plant. Because of these market dynamics, coal prices remained essentially unchanged during Winter Storm Fern.
Reflecting the pricing effects of Winter Storm Fern, dark spreads in the first four months of 2026 averaged $28/MWh, 39% more than the spread over the same period in 2025. Spark spreads over the same period averaged $9/MWh, a 15% year over year increase.
The trend in MISO is somewhat different than what we wrote about in an earlier dark and spread analysis for the PJM market.
Principal contributors: Augustine Kwon, Christopher Namovicz, Tyler Hodge
Tags: coal, Midwest, Illinois, natural gas, electricity, weather