
Electricity generation from non-hydro renewable sources varies by state
Wind accounted for most non-hydro renewable generation in 2011, but sources of renewable generation vary from state to state. However, the states with the most non-hydro renewable generation in 2011 also tend to have significant generation from wind. In 2011, renewable generation (including hydro) made up 13% of total generation.
In 2011, wind accounted for more than half of the non-hydro renewable generation in nine of the top ten states for non-hydro renewable generation. This pattern is in stark contrast to 2001, when wood-based fuels and other biomass accounted for the majority of non-hydro renewable generation in nearly all states. While solar is an important component of distributed generation, state-level solar estimates for utility-scale generation (presented here) are not yet available for all 50 states.
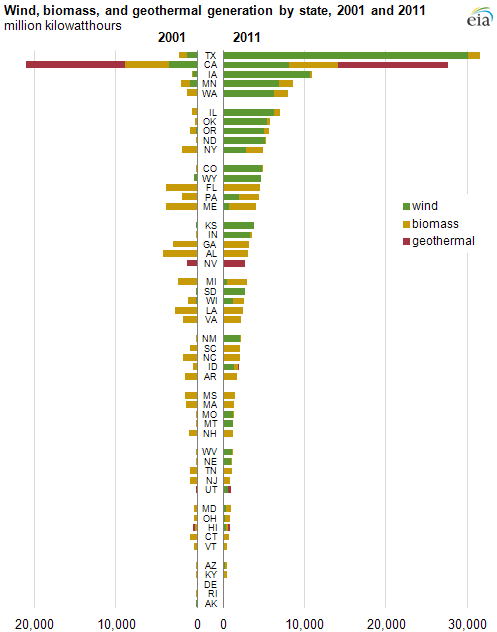
Note: Solar generation is excluded from this graph because the contribution of utility-scale solar (i.e., plants with a capacity of 1 megawatt or greater) to total renewable generation was less than one percent of the national total in both 2001 and 2011. In addition, state-level solar generation data for 2011 are not yet available for all states. States are listed by postal code.
Download CSV Data
In regions with less wind resource, wood-based fuels and other biomass still account for the majority of non-hydro renewable generation. Although non-hydro renewable generation has grown substantially in most states over the past decade, hydro generation still accounted for over 60% of total renewable generation in 2011. When considering hydro, wind, biomass, and geothermal sources of renewable electricity generation, hydro was the top renewable source for eight of the top ten states.
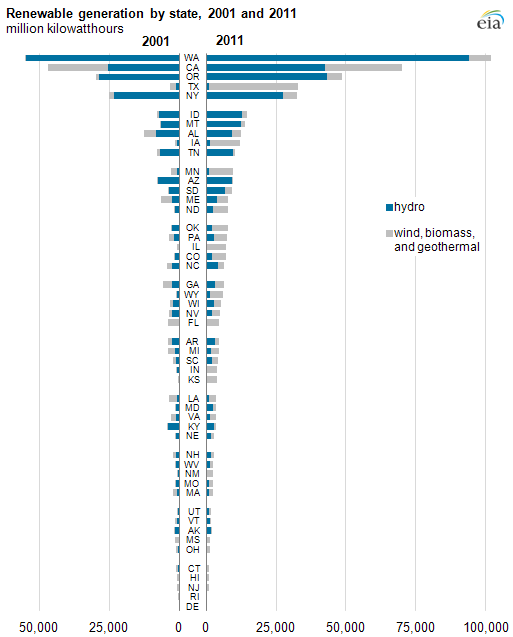
Note: Solar generation is excluded from this graph because the contribution of utility-scale solar (i.e., plants with a capacity of 1 megawatt or greater) to total renewable generation was less than one percent of the national total in both 2001 and 2011. In addition, state-level solar generation data for 2011 are not yet available for all states. States are listed by postal code.
Download CSV Data
Incentive programs and renewable portfolio standards (RPS) play an important role in encouraging the development of renewable electricity generation. However, because multiple renewable technologies generally qualify for such standards, these programs are usually technology-neutral or technology-flexible. As a result, such programs may have a greater effect on the overall level of renewable electricity development, while the ultimate distribution of renewable generation type is affected more by renewable resource cost and availability.
Wind, hydro, solar, and geothermal electricity plants can only generate power where there is an adequate on-site resource. While there is some flexibility in the range of solar and wind resource that is considered adequate for generation, geothermal power generation has very specific temperature requirements for the geothermal resource. Hydroelectric generating plants tend to form regional clusters around resources. Hydroelectric output varies dramatically from year to year and was particularly high in 2011.
The National Renewable Energy Laboratory (NREL) has mapped resource potential for onshore and offshore wind, solar photovoltaic and concentrating solar, and geothermal resources. NREL's wind resource map illustrates that the strongest resource potential for wind falls primarily in the central part of the United States, while the Southeastern and mid-Atlantic regions have relatively little area suitable for wind generation. This resource distribution correlates well with the level of wind penetration in individual states. It is important to note, however, that states with particularly strong wind resources have also generally been more successful in passing RPS legislation, creating a dual incentive to develop wind projects in such states.


Biomass generation capacity is not limited by geography to the same extent as other renewable resources because the fuel can be transported. However, because of the low heat content per unit weight of biomass fuel, the cost of transporting biomass is generally prohibitive except over relatively short distances. This factor encourages the development of biomass generation capacity in areas where there are significant resources. NREL has also compiled a biomass resource map, which encompasses wood and agricultural biomass as well as waste fuels such as landfill gas and biogenic municipal solid waste. States with significant biomass generation (e.g., Florida, Alabama, and Maine) also have considerable biomass resources.

Tags: biomass, electricity, generation, geothermal, hydroelectric, renewables, solar, states, wind