Shares of electricity generation from renewable energy sources up in many states
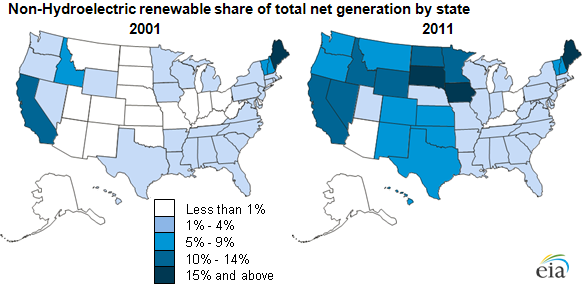
Notes: Non-hydroelectric renewables include generation from wind, solar, geothermal, and other renewable sources such as wood and wood wastes, municipal solid wastes, landfill gas, etc. Data for 2011 are preliminary.
Non-hydroelectric renewable generation has increased in many states over the past decade. In 2011, Maine had the highest percentage of non-hydroelectric renewable generation, at 27% of total in-state generation, up from 20% in 2001 (see maps). South Dakota and Iowa followed, with 21% and 17%, respectively, in 2011, up from 1% and less than one percent in 2001. Wind is the largest driver of this increase across all states.
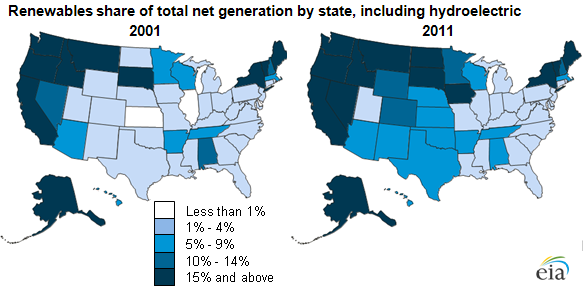
Note: Data for 2011 are preliminary.
Including hydropower changes the picture dramatically. Hydroelectric generation is often separated from other renewable generation as it is both larger (on a national basis) and highly variable from year to year. Some states generate considerably more electricity than they consume. In particular, significant excess hydropower generation in the Pacific Northwest flows south to California in the spring. In 2011, the states with the largest shares of generation coming from renewables, including hydro, were: Idaho (93%), Washington (82%), and Oregon (78%). Hydroelectric production was particularly high in 2011 in the Pacific Northwest.
More than half of all states have put in place Renewable Portfolio Standards to promote generation from renewable sources. Federal production tax credits and grants also contributed to increases in renewable capacity and generation between 2001 and 2011. Wind was the fastest growing source of non-hydroelectric renewable generation, as many operators of wind turbines have benefited from these programs. Detailed descriptions of the various State RPS programs (which may not count all non-hydro renewables as eligible) are available from the Database of State Incentives for Renewables & Efficiency.
EIA recently released preliminary data through December 2011 on generation, fuel consumption, and other statistics from the electric power industry in the Electric Power Monthly and Electricity Monthly Update. A significant share of generation from biomass and solar photovoltaic resources occurs in the end-use industrial, residential, and commercial sectors and is not included in the utility-scale electric power data presented here.
Tags: biomass, California, electricity, generation, hydroelectric, Maine, Northwest, Oregon, renewables, solar, states, Washington, wind