
Low U.S. gasoline demand is making gasoline less profitable, reducing crack spreads
Note: RBOB=reformulated blendstock for oxygenate blending
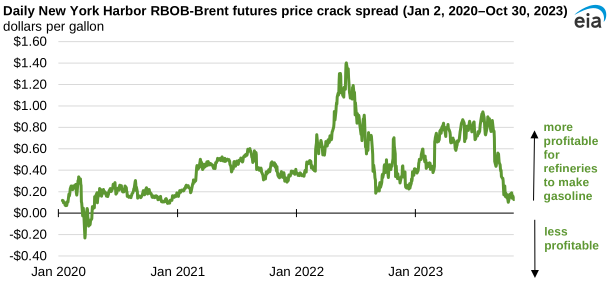
Low gasoline demand in combination with the seasonal switch to winter-grade gasoline has made gasoline less profitable to produce, reducing the difference between gasoline blendstock and crude oil prices to multiyear lows in October 2023.
The crack spread is the difference between the price of a wholesale petroleum product and the crude oil price, and it can serve as an indicator of refining profits. The crack spread between New York Harbor RBOB and Brent crude oil is helpful in understanding the profitability of U.S. gasoline refining because it is the difference between the price of the petroleum component of gasoline used in many parts of the United States (RBOB) and Brent crude oil.
The RBOB-Brent crack spread decreased in August after reaching a summer high of 94 cents per gallon (gal) on July 27, ending the month at 70 cents/gal. The crack spread subsequently fell in September, ending the month at 17 cents/gal. In October, this crack spread averaged 16 cents/gal, the lowest monthly average since December 2020.
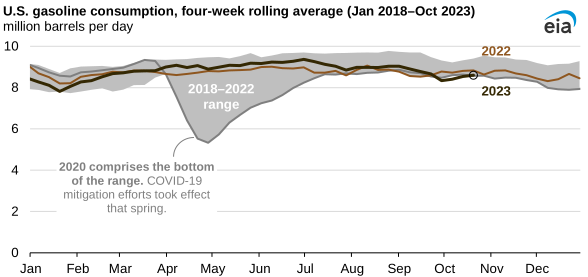
One reason gasoline crack spreads have decreased recently is low U.S. gasoline consumption. Based on weekly estimates in our Weekly Petroleum Status Report (WPSR), U.S. gasoline consumption, measured as product supplied, has been less than its lows both in 2022, when demand was down after months of high summer gasoline prices and inflation, and in 2020, when responses to the COVID-19 pandemic reduced demand. Some factors that may be reducing gasoline demand this year include higher gasoline prices, less discretionary spending due to persistently high inflation, and improved fuel efficiency of vehicles.
Note: Consumption is measured as product supplied.
Another factor affecting crack spreads is above-average U.S. gasoline production. Our WPSR estimates suggest that U.S. refinery runs this year were above average in September and were near average in October. Despite the low crack spreads, refineries have continued to produce gasoline at an average rate because the other products they produce alongside gasoline have remained sufficiently profitable to continue gasoline production despite low demand.
Low gasoline demand and relatively average refinery production have increased U.S. gasoline inventories. As of October 13, U.S. gasoline inventories were up 4% from the beginning of September, totaling 223.3 million barrels.
Principal contributor: James Troderman