
Per capita U.S. residential electricity use was flat in 2020, but varied by state
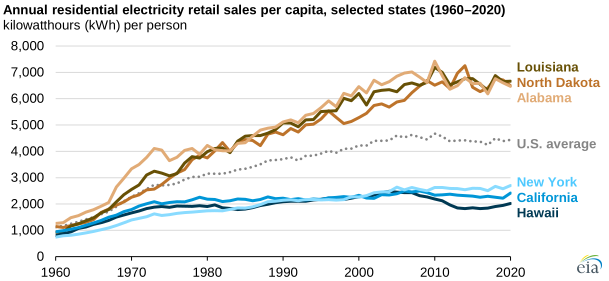
Although many people spent more time at home during 2020 in response to the COVID-19 pandemic, retail sales of electricity to the residential sector in the United States, calculated per capita (per person), averaged 4,437 kilowatthours (kWh) per person, only 1% more than in 2019. Warmer weather in 2020 (including a significantly warmer winter) increased electricity consumption for air conditioning during the summer but reduced U.S. home electricity consumption for space heating during the winter.
From 1960 to 2010, per capita U.S. residential electricity use increased by an average of 3% per year. However, that trend reversed over the past decade because of warmer weather and energy efficiency improvements. Per capita residential electricity use has fallen 5% in the United States since 2010.
Weather is a significant driver of residential electricity sales in the United States. During the summer, warm weather increases electricity consumption in homes as residents use air conditioners, fans, dehumidifiers, and other equipment to maintain comfortable temperatures. During the winter, colder temperatures increase consumption as residents turn on heating equipment to keep their homes warm.
The extent to which cold weather influences residential electricity demand during the winter depends on home heating fuel choices. According to the U.S. Census Bureau, about 39% of U.S. homes use electricity as their primary heating source.
Per capita U.S. residential electricity use varied widely across the states in 2020, from 2,018 kWh per person in Hawaii to 6,663 kWh per person in Louisiana. Nearly all of the states with the highest residential electricity sales per capita, such as Louisiana, Alabama, and Mississippi, are in the South census region, where air conditioning and electric space heating are most prevalent. About 64% of southern homes heat primarily with electricity, compared with about 25% of homes outside of the South.
The only state with relatively high per capita residential electricity use outside of the South is North Dakota, which has the coldest average annual temperature in the Lower 48 states. About 41% of homes in North Dakota heat with electricity.
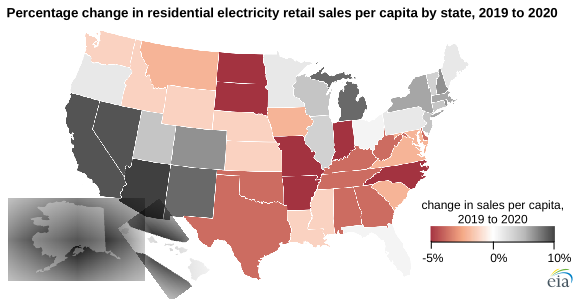
In 2020, per capita residential electricity use decreased in many of the states where electricity is widely used for home heating, including many states in the South. In 2020, the District of Columbia’s per capita residential electricity use fell 4% compared with 2019, a larger decrease than for any of the states, followed by Arkansas (-4%) and North Dakota, Indiana, North Carolina, South Dakota, and Missouri (-3% each).
However, per capita residential electricity use rose significantly in the West census region; many states in this region experienced their warmest summers on record in 2020. Arizona’s per capita residential electricity use increased 10% compared with 2019, the largest increase of any state, followed by Nevada, Alaska, and California (9% each).
Principal contributor: Mickey Francis