
March saw major declines in U.S. demand for petroleum products
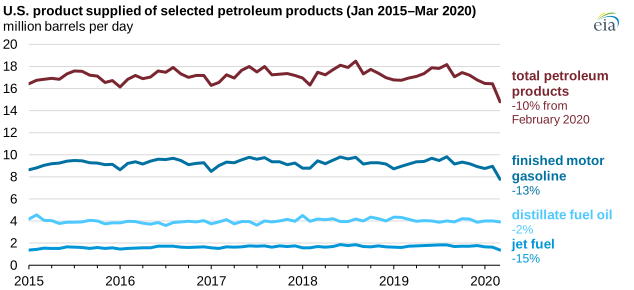
As stay-at-home orders and mitigation efforts for the 2019 novel coronavirus disease (COVID-19) took effect and limited travel starting in the second half of March 2020, gasoline and jet fuel demand (as measured by product supplied) fell by near-record amounts, according to data in the U.S. Energy Information Administration’s Petroleum Supply Monthly.
From February to March, gasoline demand fell by 1.2 million barrels per day (b/d) (13%) to 7.8 million b/d, the lowest level since January 2000 and the second-largest monthly decline on record. During the same period, jet fuel demand fell by 242,000 b/d (15%), the largest single monthly change in U.S. jet fuel demand in EIA’s data, which dates back to 1965.
By comparison, demand for distillate fuel in March remained near its January and February levels, falling only 98,000 b/d (2%). Because of its stronger ties to economic activity, distillate consumption was initially less affected by COVID-19 mitigation efforts than gasoline and jet fuel, which are more closely tied to commuting and personal travel.
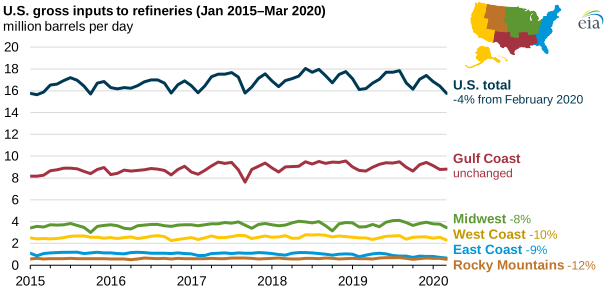
The drop in demand for petroleum products led refineries to limit operations: U.S. gross inputs into refineries fell by 670,000 b/d (4%) from February to March to average 15.8 million b/d, the lowest monthly level since October 2015.
The U.S. Gulf Coast region, or Petroleum Administration for Defense District (PADD) 3, is home to more than half of U.S. refining capacity. Unlike refinery runs in other regions of the United States, Gulf Coast refinery runs remained relatively unchanged between February and March as some refineries in the region returned to operation after maintenance in February. Also, Gulf Coast refineries tend to provide petroleum products to be exported or shipped to other parts of the United States, meaning their operations are less connected to in-region changes in demand.
Refineries in the other parts of the country decreased operations in March. In particular, gross inputs into refineries on the West Coast fell by 267,000 b/d (10%) from February to March.
Rapid changes in petroleum product demand and relatively slower changes in crude oil production and refinery operations led to increases in petroleum inventories. From February to March, U.S. crude oil inventories increased by 28.2 million barrels (6%) to reach 482 million barrels, the third-largest month-over-month increase in EIA data, which dates back to 1981, the beginning of the modern Petroleum Supply Reporting System.
As a result of these increases in inventory levels, in early April, EIA began to track oil storage utilization in the Weekly U.S. and regional crude oil stocks and working storage capacity report. This weekly tracker indicated that U.S. crude oil stocks reached 52% of working capacity the last week of March.
The data series presented in EIA’s Petroleum Supply Monthly are considered EIA’s definitive estimates of petroleum supply, disposition, and inventories. Other EIA products such as the Weekly Petroleum Status Report and the Short-Term Energy Outlook also provide near-term estimates and forecasts, respectively, of petroleum market metrics. A previous Today in Energy article discusses the differences in these products.
Principal contributor: Matthew French