
U.S. natural gas production reaches a new record despite low prices
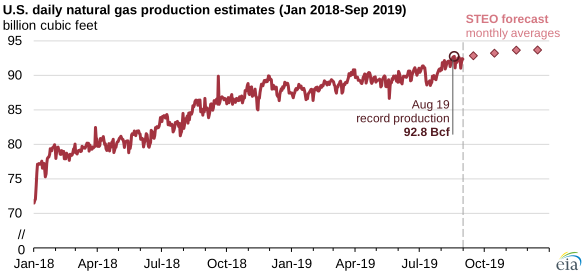
U.S. natural gas production continued to increase in August, setting a new daily production record of 92.8 billion cubic feet per day (Bcf/d) on August 19, 2019, according to estimates from IHS Markit. Natural gas production also set a new monthly record in August, averaging more than 91 Bcf/d for the first time. In the latest Short-Term Energy Outlook (STEO), released on September 10, 2019, the U.S. Energy Information Administration (EIA) forecasts dry natural gas production to average 93.4 Bcf/d from September through the end of the year. U.S. natural gas production increased by 7.1 Bcf/d (8%) between August 2018 and August 2019, led by production gains primarily in the Northeast.
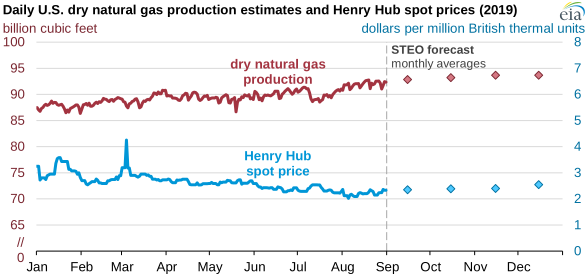
U.S. natural gas production has increased, even as natural gas prices have declined. Natural gas spot prices at the national price benchmark Henry Hub have been on a downward trend since early spring. Spot prices at other natural gas hubs across the country have continued to sell at discounts to Henry Hub.
Record growth in U.S. natural gas production continues to put downward pressure on prices. This summer, prices have continued to decline despite high levels of natural gas exports and increased consumption in the electric generation sector.
Henry Hub prices averaged $2.40 per million British thermal units (MMBtu) in June and $2.37/MMBtu in July—the lowest monthly averages for June and July since 1999—as growth in natural gas production continued to offset growth in consumption. In its September STEO, EIA forecasts Henry Hub prices to increase through the remainder of the year, ultimately averaging $2.55/MMBtu in December.
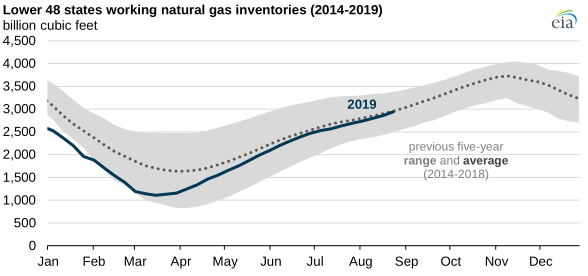
Natural gas storage has been absorbing a significant amount of the increase in U.S. production. Working natural gas inventories in the Lower 48 states began the injection season (April 1) about 30% lower than the previous five-year (2014–18) average level for that time of year. By the week ending August 30, 2019, working natural gas inventories were just 3% lower than the five-year average for that time of year. The net injection rate into storage during that time was equal to 11.9 Bcf/d, or about 30% more than the typical injection rate for that period, based on the average of the previous five years.
Principal contributor: David Manowitz