
China’s projected energy consumption mainly depends on its overall growth rate
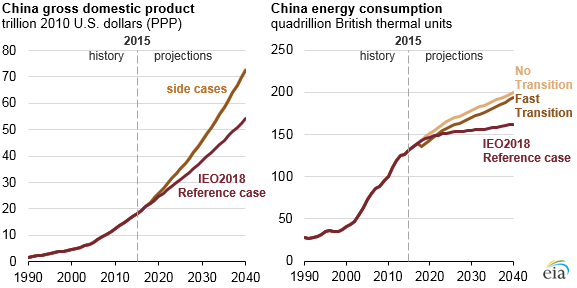
Note: PPP is purchasing power parity.
As the world’s top producer of energy-intensive goods, China’s energy consumption is tied to both its rate of economic growth and the size of its energy-intensive manufacturing industries. Chinese policy goals call for a move away from heavy industry toward a less energy-intensive economy with a greater focus on service industries. Two side cases from EIA’s International Energy Outlook 2018 (IEO2018) show that faster economic growth in China means higher energy use, which is only modestly affected by how quickly China transitions to a more personal consumption-based, service-oriented economy.
China’s 13th Five-Year Plan, adopted in March 2016, includes several objectives to prioritize the production of goods that are less energy intensive. Another objective is to raise the service sector’s share of China’s gross domestic product (GDP) to 56% by 2020. The IEO2018 Reference case assumes that China gradually transitions to an economy with greater personal consumption and a larger service sector as a share of total production. Two IEO2018 side cases consider the energy implications of faster Chinese economic growth, but they vary as to whether or not China’s economy transitions to a more service-oriented economy or remains similar to its current structure.
These two side cases assume a greater rate of GDP growth than the IEO2018 Reference case: real Chinese GDP is projected to grow by an average of 5.7% per year between 2015 and 2040, compared with 4.5% per year projected in the IEO2018 Reference case. The cases differ by the components of GDP responsible for this increase: one focuses on higher investment and exports compared with the IEO2018 Reference case, and the other focuses on higher personal consumption.
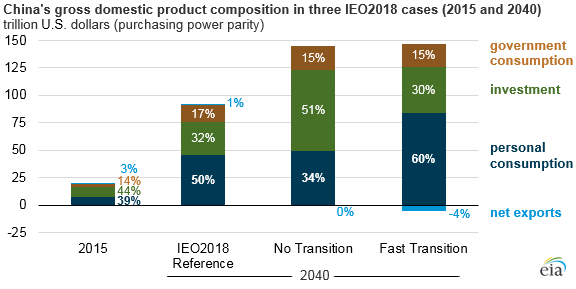
In the No Transition case, investment—purchases of structures, equipment, and software by businesses or governments—accounts for a larger share of GDP in 2040 than in either the IEO2018 Reference case or the Fast Transition case. The production structure of China’s economy still shifts to services but at a slower rate than in either of the other two cases. Delivered energy consumption increases 28 quadrillion British thermal units (Btu) higher than the Reference case in 2040, or 23% higher than 2015 levels.
In the Fast Transition case, personal consumption—all of the goods and services purchased by consumers—accounts for a larger share of GDP in 2040 than in either the IEO2018 Reference case or the No Transition case. China’s shift to services is fastest in this case: by 2040, services make up 48% of China’s gross output. China’s total energy consumption increases by 23 quadrillion Btu, or 19% higher than the 2015 level.
In both cases, the manufacturing shares of the economy are similar—40% in the No Transition case and 38% in the Fast Transition case. Manufacturing production tends to be more energy intensive than other sectors, and this relatively small difference between cases accounts for much of the difference in China’s energy consumption.
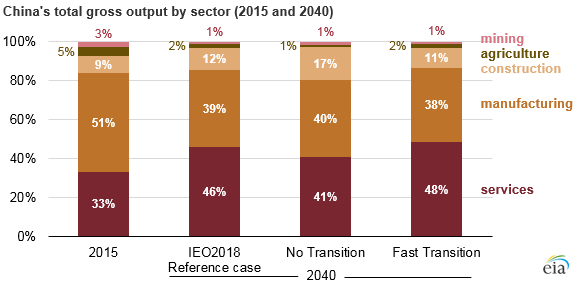
In 2015, China’s industrial sector consumed 71 quadrillion Btu; by 2040, that value is projected to be 85 quadrillion Btu in the Slow Transition case or 80 quadrillion Btu in the Fast Transition case. Changes in all other end-use sectors (residential, commercial, transportation) are relatively minimal. In both cases, China remains the world’s top producer of energy-intensive goods.
Principal contributors: Vipin Arora, George Pantazopoulos, Henry Tolchard