
U.S. natural gas processing capacity expands rapidly
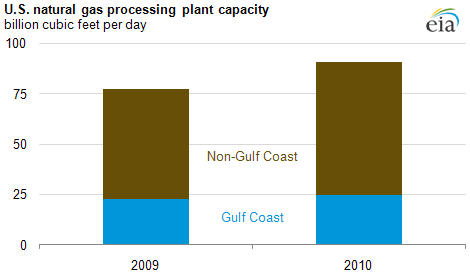
Note: Gulf Coast includes onshore plants in the southern half of Louisiana, Alabama, and Mississippi, and near the coast of Texas (see Map). Non-Gulf Coast plants include onshore plants not located in the Gulf Coast area.
Download CSV Data
Natural gas that flows from the wellhead often contains impurities and/or valuable liquid components that must be removed before the product can be distributed to natural gas customers. The natural gas processing plants that perform this function are thus a crucial link between production and the market. As natural gas production has shifted from offshore to onshore areas, additions to natural gas processing capacity mostly occurred in non-Gulf Coast areas (all processing plants are onshore).
Between 2009 and 2010, operators added about 13.3 billion cubic feet per day (Bcfd) of capacity, and 86% of that addition was located in non-Gulf Coast areas. Overall capacity grew from 77.5 Bcfd to 90.8 Bcfd (see chart). As natural gas production expands in new areas, additional natural gas processing and pipeline capacity may be needed; news reports indicate that a shortage of processing capacity in the northeast may be a bottleneck in the continuing development of the Marcellus shale.
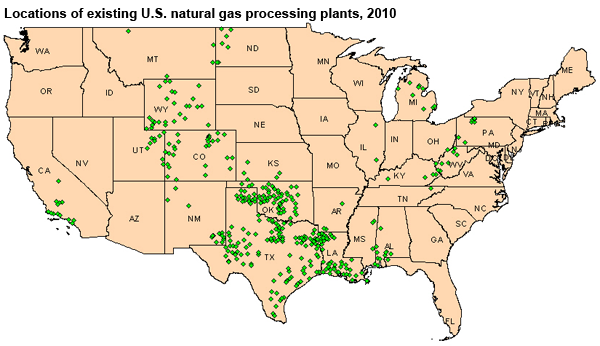
Total U.S. processing capacity has grown to keep up with higher overall levels of production, although new plants often have less capacity than existing plants (see map). Some of the new plants are "mobile," that is, they process gas until doing so is no longer economically viable, and then they disassemble and relocate to another part of the country. This kind of flexibility is important as the industry changes its sources of production and consumption.
In the Gulf Coast region, some processing plants have shifted from processing offshore production from the Gulf of Mexico to processing natural gas from the Haynesville shale play in Louisiana and the Barnett shale play in Texas. As a result, Gulf Coast processing capacity has continued to grow despite decreasing offshore production. Higher prices for natural gas liquids, one of the components removed in the processing, provide an additional incentive to build more processing facilities.
During significant emergencies, such as hurricanes, EIA tracks shut-in natural gas processing capacity through the emergency schedule on the survey of natural gas processing plants, Form EIA-757B. Responses from this survey provide important insight into any potential disruption to the supply chain caused by reduced processing capacity. EIA provides this information to the public through hurricane reports posted on its website.
Tags: Gulf Coast, map, natural gas, offshore, production/supply, states, weather