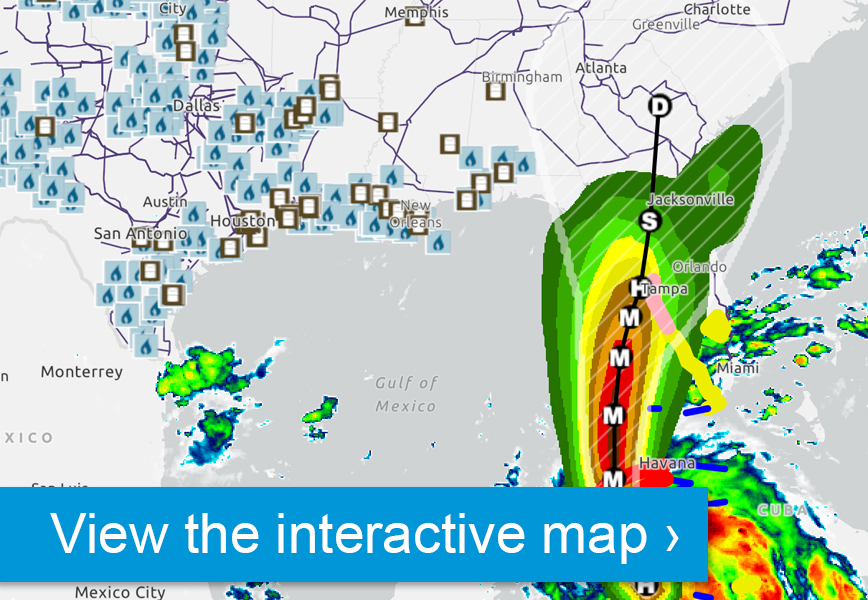
The Gulf of Mexico area, both onshore and offshore, is one of the most important regions for energy resources and infrastructure. Gulf of Mexico federal offshore oil production accounts for 14% of total U.S. crude oil production and federal offshore natural gas production in the Gulf accounts for 5% of total U.S. dry production. Over 48% of total U.S. petroleum refining capacity is located along the Gulf coast, as well as 51% of total U.S. natural gas processing plant capacity.
Release Date: September 4, 2024
Energy Data all tables
+ EXPAND ALL| U.S. Petroleum and Other Liquids Facts for 2023 | |||||||
|---|---|---|---|---|---|---|---|
|
million barrels per day |
Share of total U.S. liquid fuels supplied |
|||||
| Liquid Fuels Production | 22.0 | 109% | |||||
| U.S. Crude Oil Production | 12.9 | 64% | |||||
| Total U.S. Federal Offshore | 1.9 | 9% | |||||
| Gulf of Mexico Federal Offshore | 1.9 | 9% | |||||
| Natural Gas Liquids | 6.5 | 32% | |||||
| Refinery Processing Gain | 1.0 | 5% | |||||
| Biofuels | 1.3 | 7% | |||||
| Other1 | 0.2 | 1% | |||||
| Stocks Withdrawn | 0.0 | 0% | |||||
| Net Imports | -1.7 | -8% | |||||
| Gross Imports into Gulf Coast | 1.9 | 10% | |||||
| Total U.S. Liquid Fuels Supplied2 | 20.3 | 100% | |||||
| Federal Offshore share of U.S. crude oil production | 15% | ||||||
| Gulf of Mexico Federal Offshore share of U.S. crude oil production | 14% | ||||||
|
|||||||
| U.S. Crude Oil, Lease Condensate, and Natural Gas Liquid Proved Reserves, Year-end 2022 | |||||||
| million barrels | |||||||
| Crude oil and Lease Condensate |
Natural Gas Plant Liquids |
Total | |||||
| U.S. Total Offshore | 5,191 | 396 | 5,587 | ||||
| U.S. Federal Offshore | 4,939 | 368 | 5,307 | ||||
| U.S. State Offshore | 252 | 28 | 280 | ||||
| U.S. Onshore | 43,130 | 32,181 | 75,311 | ||||
| U.S. Total Reserves | 48,321 | 32,577 | 80,898 | ||||
| Total Gulf Offshore | 4,884 | 395 | 5,279 | ||||
| Federal Gulf of Mexico | 4,860 | 367 | 5,227 | ||||
| Gulf States Offshore | 24 | 28 | 52 | ||||
| Total Offshore Percent of Total Reserves | 11% | 1% | 12% | ||||
| Total Gulf Offshore Percent of Total Reserves | 10% | 1% | 11% | ||||
| Note: Alaskan reserves are all shown as onshore. | |||||||
| Data source: U.S. Energy Information Administration, U.S. Crude Oil and Natural Gas Proved Reserves, Year-end 2022 | |||||||
| U.S. Natural Gas Facts for 2018 | |||||||
|
trillion cubic feet | Share of Total U.S. Natural Gas Consumed |
|||||
| U.S. Dry Gas Production | 30.4 | 96% | |||||
| Total Federal Offshore Dry Production | 0.9 | 4% | |||||
| Federal Gulf of Mexico Offshore Dry Production | 0.9 | 4% | |||||
| Supplemental Gaseous Fuels | 0.1 | 0% | |||||
| Net Imports | -0.7 | 4% | |||||
| LNG Imports into Gulf Coast | 0 | 0% | |||||
| Net Storage Withdrawals | 0.3 | -1% | |||||
| Balancing Item | -0.2 | 0% | |||||
| Total U.S. Natural Gas Consumed | 30.0 | 100% | |||||
| Federal Offshore Share of U.S. Dry Natural Gas Production | 3% | ||||||
| Federal Gulf of Mexico Offshore Share of U.S. Dry Natural Gas | 3% | ||||||
| Data source: U.S. Energy Information Administration, Natural Gas Monthly (June 2019), DOE Office of Fossil Energy Import/Export Data, and EIA estimates. | |||||||
| U.S. Natural Gas Proved Reserves, Year-end 2022 | |||||||
| trillion cubic feet | |||||||
| U.S Total Offshore | 5.3 | ||||||
| U.S. Federal Offshore | 5.1 | ||||||
| U.S. State Offshore | 0.2 | ||||||
| U.S. Onshore | 685.7 | ||||||
| U.S. Total Reserves | 691.0 | ||||||
| Total Gulf Offshore | 5.2 | ||||||
| Federal Gulf of Mexico | 5.1 | ||||||
| Gulf States Offshore | 0.1 | ||||||
| Total Offshore Percent of Total Reserves | 1% | ||||||
| Total Gulf Offshore Percent of Total Reserves | 1% | ||||||
| Data source: U.S. Energy Information Administration, U.S. Crude Oil and Natural Gas Proved Reserves, Year-end 2022 | |||||||
| U.S. Gulf Coast Operable Refinery Capacity As Of January 2024 | |||||||
| barrels per calendar day | |||||||
| Refiner | Refinery | State | Capacity | ||||
| Louisiana Gulf Coast Refining District | |||||||
| Alon Refining Krotz Springs Inc | Krotz Springs | LA | 80,000 | ||||
| Calcasieu Refining Co | Lake Charles | LA | 135,500 | ||||
| Chalmette Refining LLC | Chalmette | LA | 190,000 | ||||
| Chevron USA Inc | Pascagoula | MS | 356,440 | ||||
| Citgo Petroleum Corp | Lake Charles | LA | 455,000 | ||||
| ExxonMobil Refining & Supply Co | Baton Rouge | LA | 522,500 | ||||
| Marathon Petroleum Company LP | Garyville | LA | 597,000 | ||||
| Phillips 66 Company | Westlake | LA | 264,000 | ||||
| Placid Refining Co | Port Allen | LA | 75,000 | ||||
| Shell Oil Products U.S. | Norco | LA | 233,702 | ||||
| Valero Refining - Meraux LLC | Meraux | LA | 125,000 | ||||
| Valero Refining New Orleans LLC | Norco | LA | 215,000 | ||||
| Vertex Refining Alabama LLC | Saraland | LA | 88,000 | ||||
| Subtotal | 3,337,142 | ||||||
| Texas Gulf Coast Refining District | |||||||
| Buckeye Texas Processing LLC | Corpus Christi | TX | 60,000 | ||||
| Citgo Refining & Chemical Inc | Corpus Christi | TX | 165,000 | ||||
| Deer Park Refining LP | Deer Park | TX | 312,500 | ||||
| ExxonMobil Refining & Supply Co | Baytown | TX | 564,440 | ||||
| ExxonMobil Refining & Supply Co | Beaumont | TX | 609,024 | ||||
| Flint Hills Resources LP | Corpus Christi, East | TX | 74,500 | ||||
| Flint Hills Resources LP | Corpus Christi, West | TX | 268,500 | ||||
| Hartree Refining LLC | Channelview | TX | 45,000 | ||||
| Houston Refining LP | Houston | TX | 263,776 | ||||
| Kinder Morgan Crude & Condensate | Galena Park | TX | 105,000 | ||||
| Magellan Processing LP | Corpus Christi | TX | 42,500 | ||||
| Marathon Petroleum Company LP | Galveston Bay | TX | 631,000 | ||||
| Motiva Enterprises LLC | Port Arthur | TX | 626,000 | ||||
| Pasadena Refining Systems Inc | Pasadena | TX | 112,229 | ||||
| Petromax Refining Co LLC | Houston | TX | 25,000 | ||||
| Phillips 66 Company | Sweeny | TX | 265,000 | ||||
| Premcor Refining Group Inc | Port Arthur | TX | 360,000 | ||||
| Texas International Terminals | Galveston | TX | 45,000 | ||||
| Total Petrochemicals Inc | Port Arthur | TX | 238,000 | ||||
| Valero Refining Co Texas LP | Corpus Christi | TX | 290,000 | ||||
| Valero Refining Co Texas LP | Houston | TX | 205,000 | ||||
| Valero Refining Co Texas LP | Texas City | TX | 225,000 | ||||
| Subtotal | 5,532,469 | ||||||
| Total U.S. Gulf Coast Capacity | 8,869,611 | ||||||
| Total U.S. Capacity | 18,384,228 | ||||||
| U.S. Gulf Coast Share of U.S. Refinery Capacity | 48% | ||||||
| Data source: U.S. Energy Information Administration, Annual Refinery Report, Table 3 | |||||||
| U.S. Gulf Coast Natural Gas Processing Plants by Geographic Location, Year-end 2017 | |||||||
| Geographic Location | Number of Plants | Total Capacity (Bcf per day) | Total Flow (Bcf/day) | Percent Utilization | Average Capacity (MMcf/day) | ||
| Alabama | 16 | 1 | 1 | 40% | 63 | ||
| Louisiana | 50 | 9 | 5 | 49% | 180 | ||
| Mississippi | 5 | 1 | <1 | 53% | 200 | ||
| Texas | 181 | 28 | 19 | 69% | 155 | ||
| Total U.S. Gulf Coast | 252 | 39 | 25 | 64% | 155 | ||
| Total U.S. | 510 | 81 | 53 | 66% | 159 | ||
| U.S. Gulf Coast Share | 49% | 48% | 47% | ||||
Units: Billion cubic feet per day (Bcf/d) and million cubic feet per day (MMcf/d). Data source: U.S. Energy Information Administration, Form EIA-757 Natural Gas Processing Plant Survey, Schedule A. |
|||||||