U.S. energy intensity projected to continue its steady decline through 2040
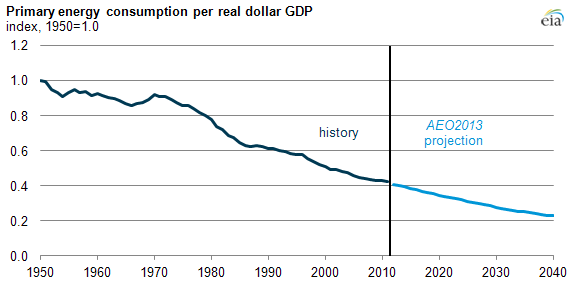
In the United States, energy intensity has been declining steadily since the early 1970s and continues to decline in EIA's long-term projection. A country's energy intensity is usually defined as energy consumption per unit of gross domestic product (GDP). Greater efficiency and structural changes in the economy have reduced energy intensity.
From 1950 to 2011, energy intensity in the United States decreased by 58% per real dollar of GDP. Until the 1970s, energy intensity was falling relatively slowly, less than 1% per year. The events surrounding the Arab oil embargo in 1973 were associated with a dramatic rise in energy prices. Before then, energy prices fluctuated only about 3% from year to year.
In 1974, energy prices rose 56% above the previous year, leading to changes in both national policy, such as the establishment of vehicle efficiency standards, and consumer attitudes. In addition, the role of energy-intensive industries in the United States declined with continuing structural changes in the economy. Since 1973, energy intensity has declined at a rate closer to 2% per year, although with a few noticeable annual increases. The 2013 Annual Energy Outlook Reference case projects that this average annual decline of 2% will continue through 2040.
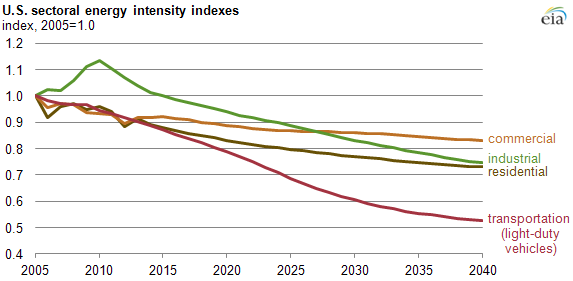
Projections to 2040 in the 2013 Annual Energy Outlook show each sector's energy intensity generally declining. Specific drivers of these declines include:
- Residential energy intensity, measured as delivered energy used per household, declines about 27% from 2005 to 2040.
- Commercial energy intensity, measured as delivered energy used per square foot of commercial floorspace, declines about 17% from 2005 to 2040.
- Industrial sector energy intensity, measured as delivered energy per dollar of industrial sector shipments, rises above its 2005 level initially owing to the 2007-09 recession but ultimately decreases 25% below its 2005 level in 2040.
- Transportation sector energy intensity is more difficult to measure because of the multiple modes of transportation. Light-duty vehicles are by far the largest energy consuming part of the sector. Light-duty vehicle energy intensity, which is measured as their consumption divided by the number of vehicle-miles traveled, is projected to decline by more than 47% from the 2005 value.