
2012 Brief: Coal prices and production in most basins down in 2012
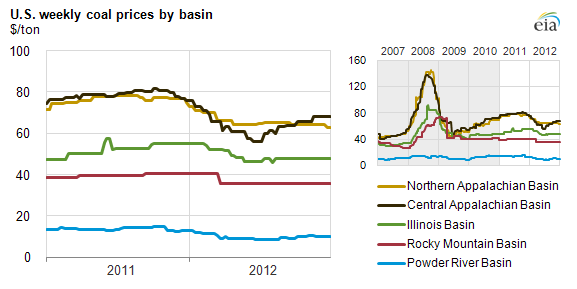
Wholesale (spot) coal prices across all basins fell during the first half of 2012 before stabilizing in the latter half of the year. Competition between natural gas and coal for electric power generation drove price declines in the Appalachian and Powder River Basins (PRB), two key sources for thermal coal, through the summer. Also, mild temperatures in the winter and high stockpiles at electric power plants limited demand for more purchases of coal in the second half of 2012.
While spot prices fell across the country, the Appalachian and Powder River Basins were affected the most. With new competition from Illinois Basin and ongoing natural gas displacement, annual average Central and Northern Appalachia prices reflected their most significant declines since 2009, falling 18% and 14%, respectively, from 2011. Average annual PRB spot prices for 2012 fell almost 30% compared to 2011. Illinois Basin coal prices declined just 5%, partially offset by a 9% increase in production because of robust demand for the low-cost, high-sulfur coal from the region.
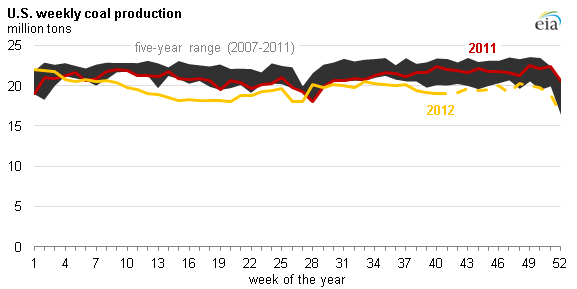
Note: Data for January 2007 through September 2012 are revised to match the Mine Safety and Health Administration (MSHA). October 2012 through December 2012 are preliminary EIA estimates.
Revised January 14, 2013: The correct value for the drop in Central Appalachia production is 16%.
U.S. coal production, down almost 7%, fell almost everywhere. Central Appalachia production decreased significantly, down 16%, followed by a 9% production decline in PRB. By contrast, coal production volumes in the Illinois Basin rose above its five-year range, up 9% from 2011.
Electric utility scrubber additions to meet proposed EPA regulations limiting sulfur dioxide (SO2) emissions underpinned much of the increasing demand for Illinois Basin's low-cost, but high-sulfur coal. With a scrubber in place, a plant using high-sulfur coal can reduce its need to buy and surrender SO2 emissions permits by 90% or more compared to a plant using the same fuel without a scrubber, making Illinois Basin coal much more competitive, especially against Central Appalachia which previously could rely on its low sulfur content as a competitive advantage. In addition to its relative low cost, Illinois Basin coal is more likely to be used in larger, more efficient plants with modern pollution control equipment, helping it compete against low natural gas prices. Record exports of both thermal and metallurgical coal partially offset declines in consumption in the power sector.
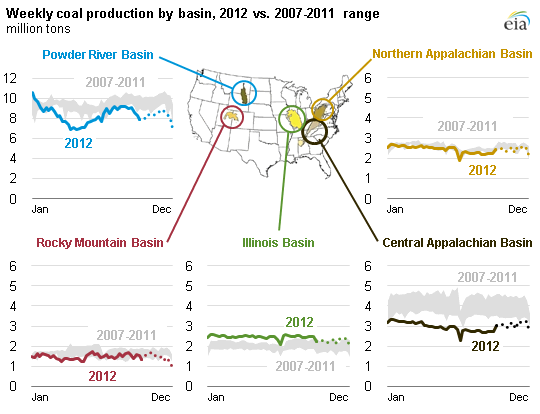
Note: Data for January 2007 through September 2012 are revised to match the Mine Safety and Health Administration (MSHA). October 2012 through December 2012 are preliminary EIA estimates and denoted with dotted lines.