
U.S. industrial natural gas consumption expected to hit records in 2026 and 2027
Data values: U.S. Natural Gas Supply, Consumption, and Inventories
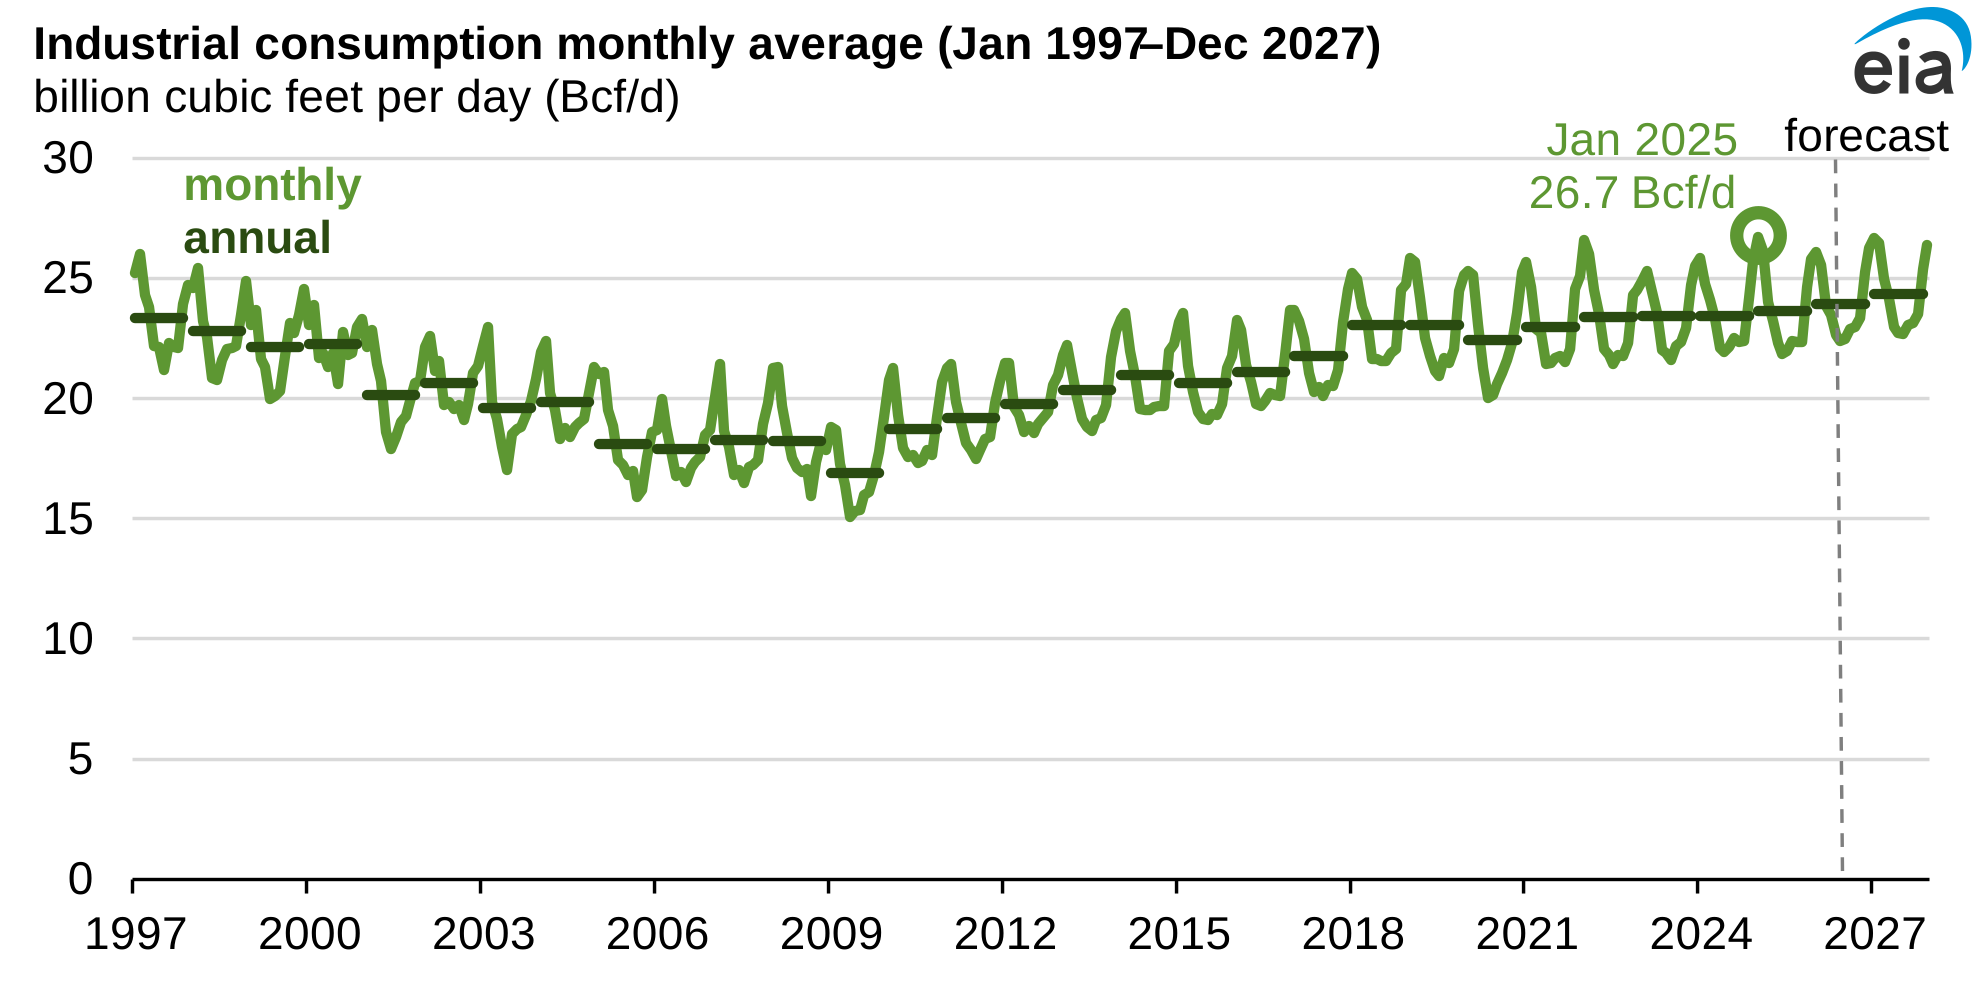
We forecast U.S. industrial natural gas consumption will climb to record highs through 2027 in our latest Short-Term Energy Outlook. Industrial consumption averaged a record 23.6 billion cubic feet per day (Bcf/d) in 2025, 1% more than the record 23.4 Bcf/d reached in 2023. In our forecast, consumption gradually increases further in 2026 and in 2027 as we expect the natural gas-weighted manufacturing index to also rise slightly over this period.
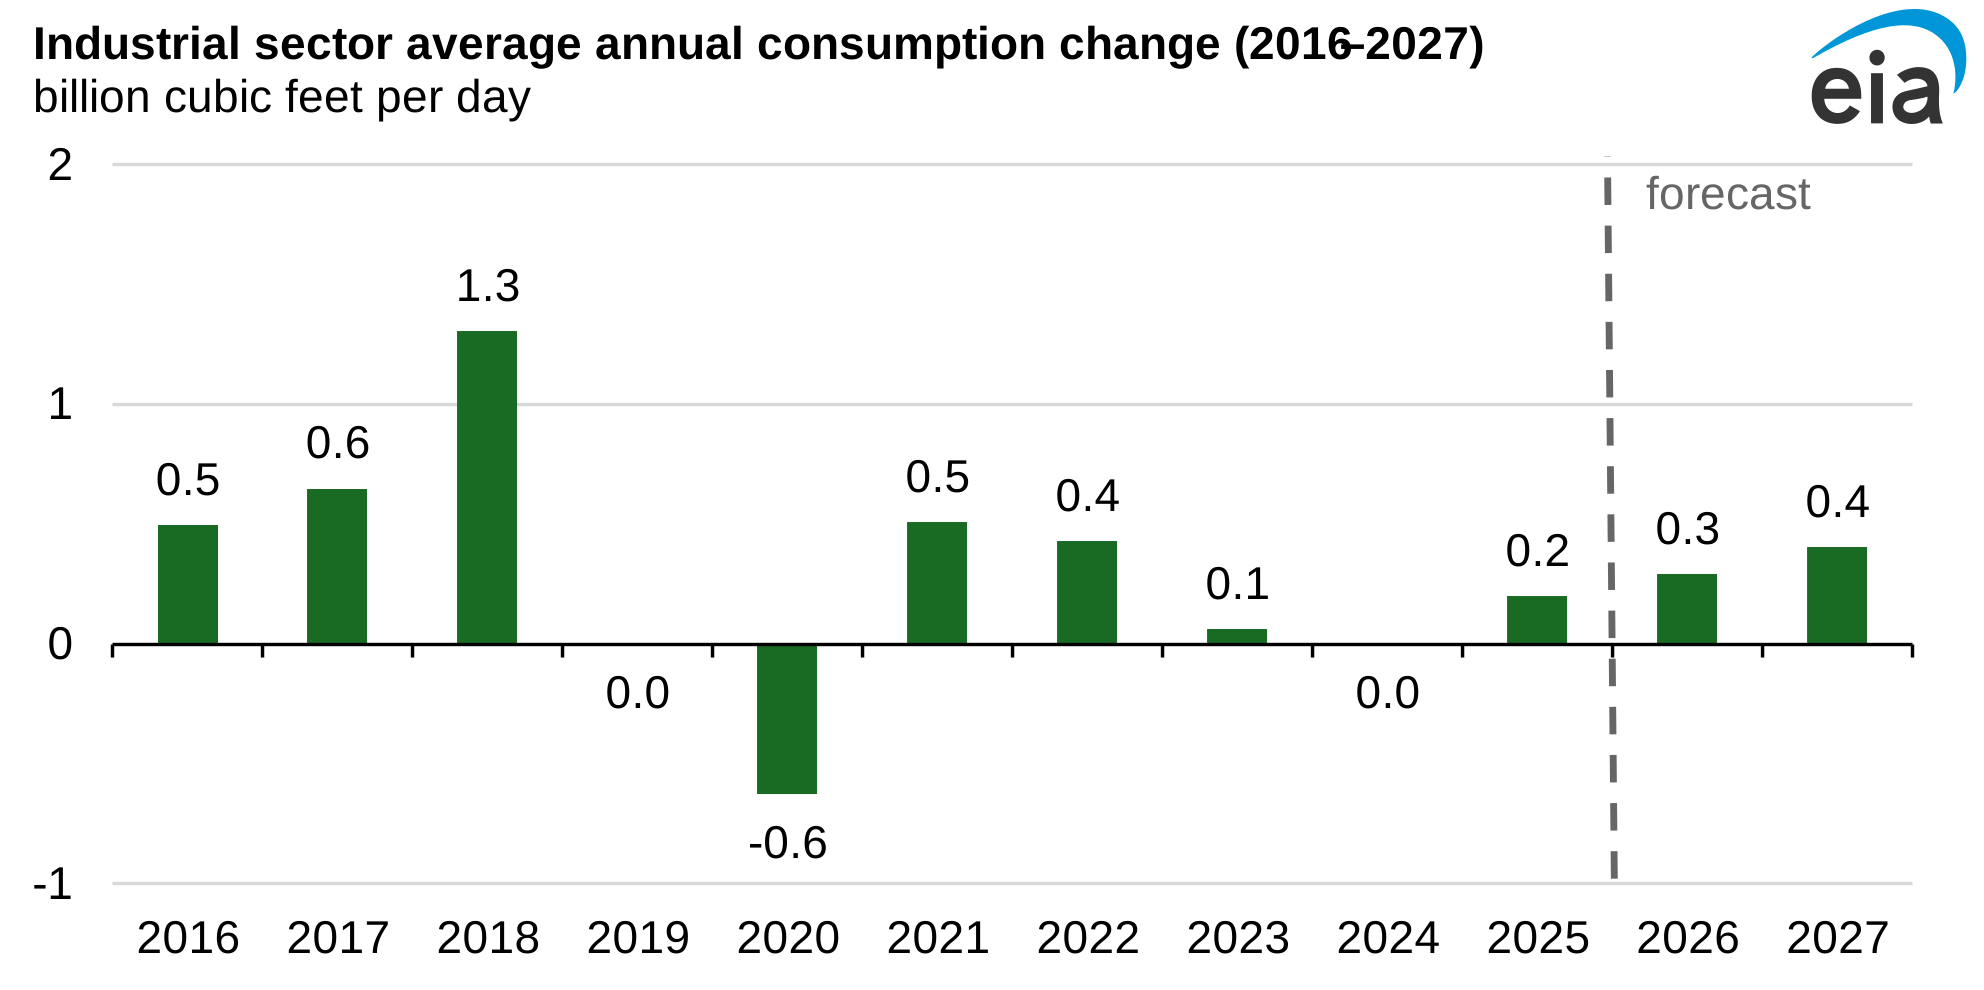
In our May STEO, we forecast average annual industrial natural gas consumption to increase by 1.2% (0.3 Bcf/d) in 2026 and 1.7% (0.4 Bcf/d) in 2027. Despite these incremental gains in annual consumption, growth remains gradual because increases in industrial activity are partially offset by efficiency gains. Continued efficiency improvements reduce the amount of natural gas needed per unit of output.
Much of industrial natural gas demand comes from the chemicals subsector and other manufacturing industries. The chemicals subsector is the largest industrial natural gas consumer, using natural gas to create heat, generate electricity, and serve as a feedstock in methanol, fertilizer, and hydrogen production.
Industrial demand shows a seasonal pattern. Consumption is typically highest in winter, when colder weather can increase heating needs at industrial facilities. Industrial natural gas consumption averaged 26.1 Bcf/d in January 2026, and we forecast it will average 26.7 Bcf/d in January 2027. By comparison, consumption reaches seasonal lows during the summer months, with forecast volumes lowest for the month of June in 2026 and 2027, averaging approximately 22.6 Bcf/d.
Industrial natural gas consumption has been relatively flat since 2018, with the main exception of the 2020 pandemic-related decline and recovery in 2021 and 2022. Relatively low U.S. natural gas prices encouraged expansion in some energy-intensive industries through the mid-2010s, including petrochemicals and ammonia production and refining, particularly in the Gulf Coast region. As a result, the industrial sector now consumes natural gas at a higher baseline rate, but the pace of new capacity additions has slowed.
Improvements in industrial efficiency have also slowed growth in industrial fuel use. Many facilities have adopted more efficient process heaters, as well as heat-recovery technologies, that reduce the amount of natural gas required per unit of output. In our forecast, however, rising industrial activity more than offsets these efficiency gains. We expect the natural gas-weighted manufacturing index to increase by 1.5% in 2026 and 0.7% in 2027, contributing to slightly higher industrial natural gas consumption over the next two years.
Principal contributor: Andrew Iraola