
EIA forecasts world oil consumption growth to slow amid less economic activity
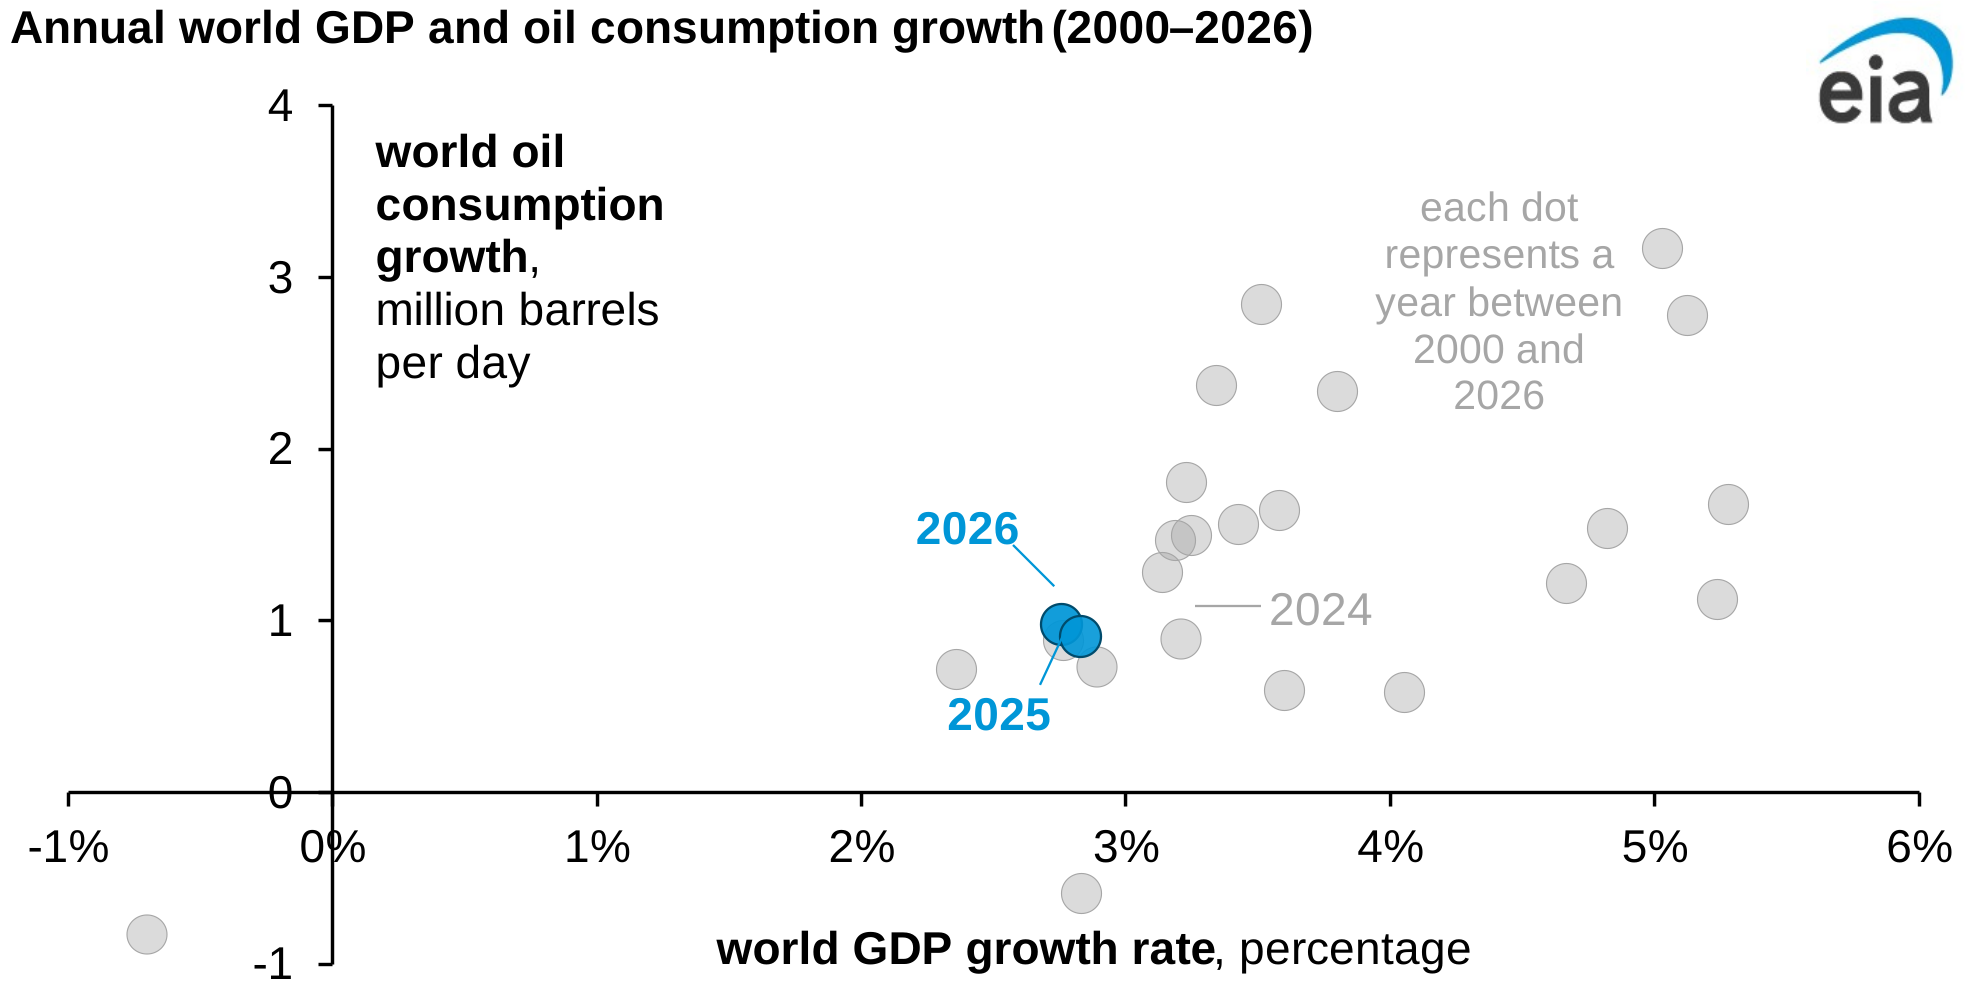
Note: Excludes 2020 and 2021 as outlier years because of the COVID-19 pandemic.
We forecast consumption growth of crude oil and other liquid fuels will slow over the next two years, driven by a slowdown in economic growth, particularly in Asia, in our May Short-Term Energy Outlook (STEO).
The world economy, measured by GDP, increases 2.8% in 2025 and 2026 in our forecast. Excluding the years of global economic contraction in 2020 and 2009, these economic growth rates would be the lowest since 2008. Considerable uncertainty over world trade, manufacturing, and investment points to downside risk in economic growth, which has a direct effect on oil consumption.
Economic activity uses energy. Increases in population, individual mobility, the shipping of goods, and industrial output result in more oil consumption. Since the year 2000, annual oil consumption growth has been the lowest during the years when the world economy grew by less than 3%. World oil consumption was around 103 million barrels per day (b/d) last year based on preliminary estimates.
The tariffs announced on U.S. trading partners in early April may have already slowed global trade in physical goods, based on preliminary container vessel departure data from Bloomberg. Less global trade will lead to fewer shipments of goods on vessels as well as fewer trucking deliveries and could affect employment and leisure travel as well. All these factors weigh on oil consumption growth.
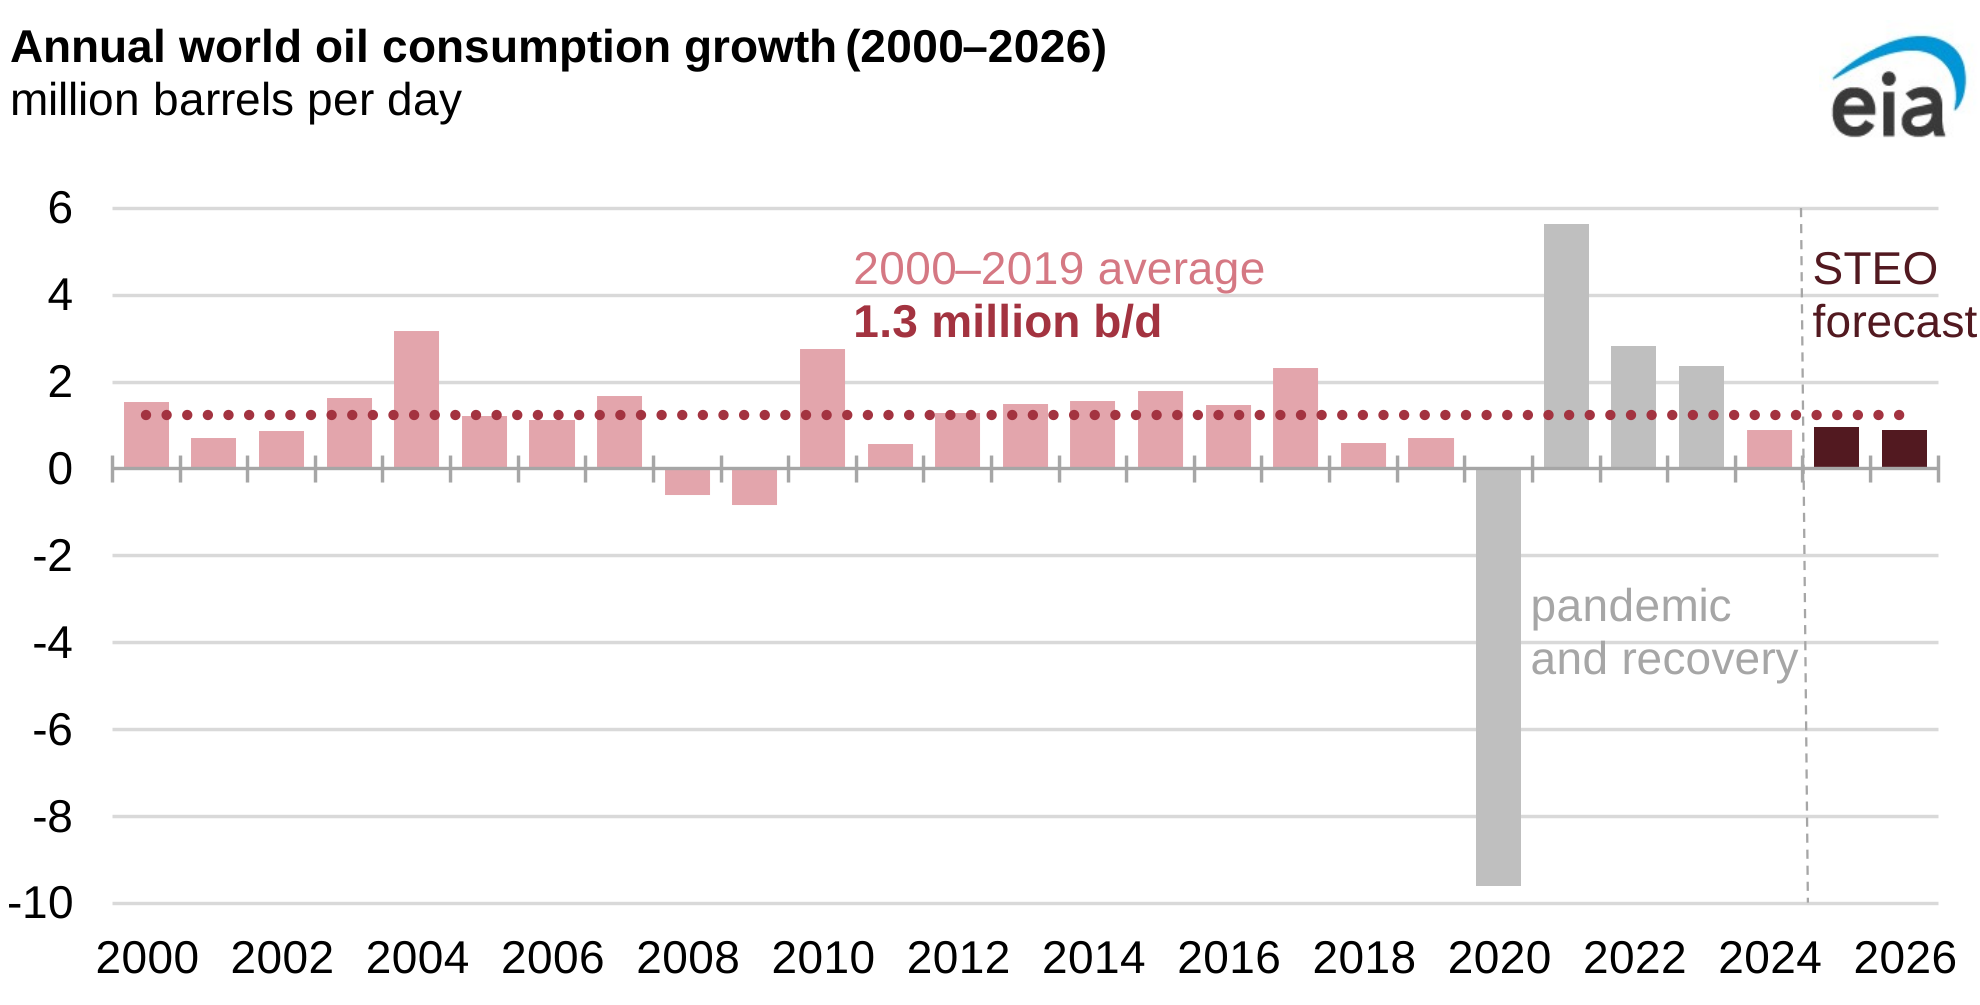
Although oil consumption will still grow, we forecast it will grow by less than 1 million b/d in 2025 and 2026, which would be three consecutive years below 1 million b/d. During the two decades before the pandemic, world oil consumption grew by an average of 1.3 million b/d.
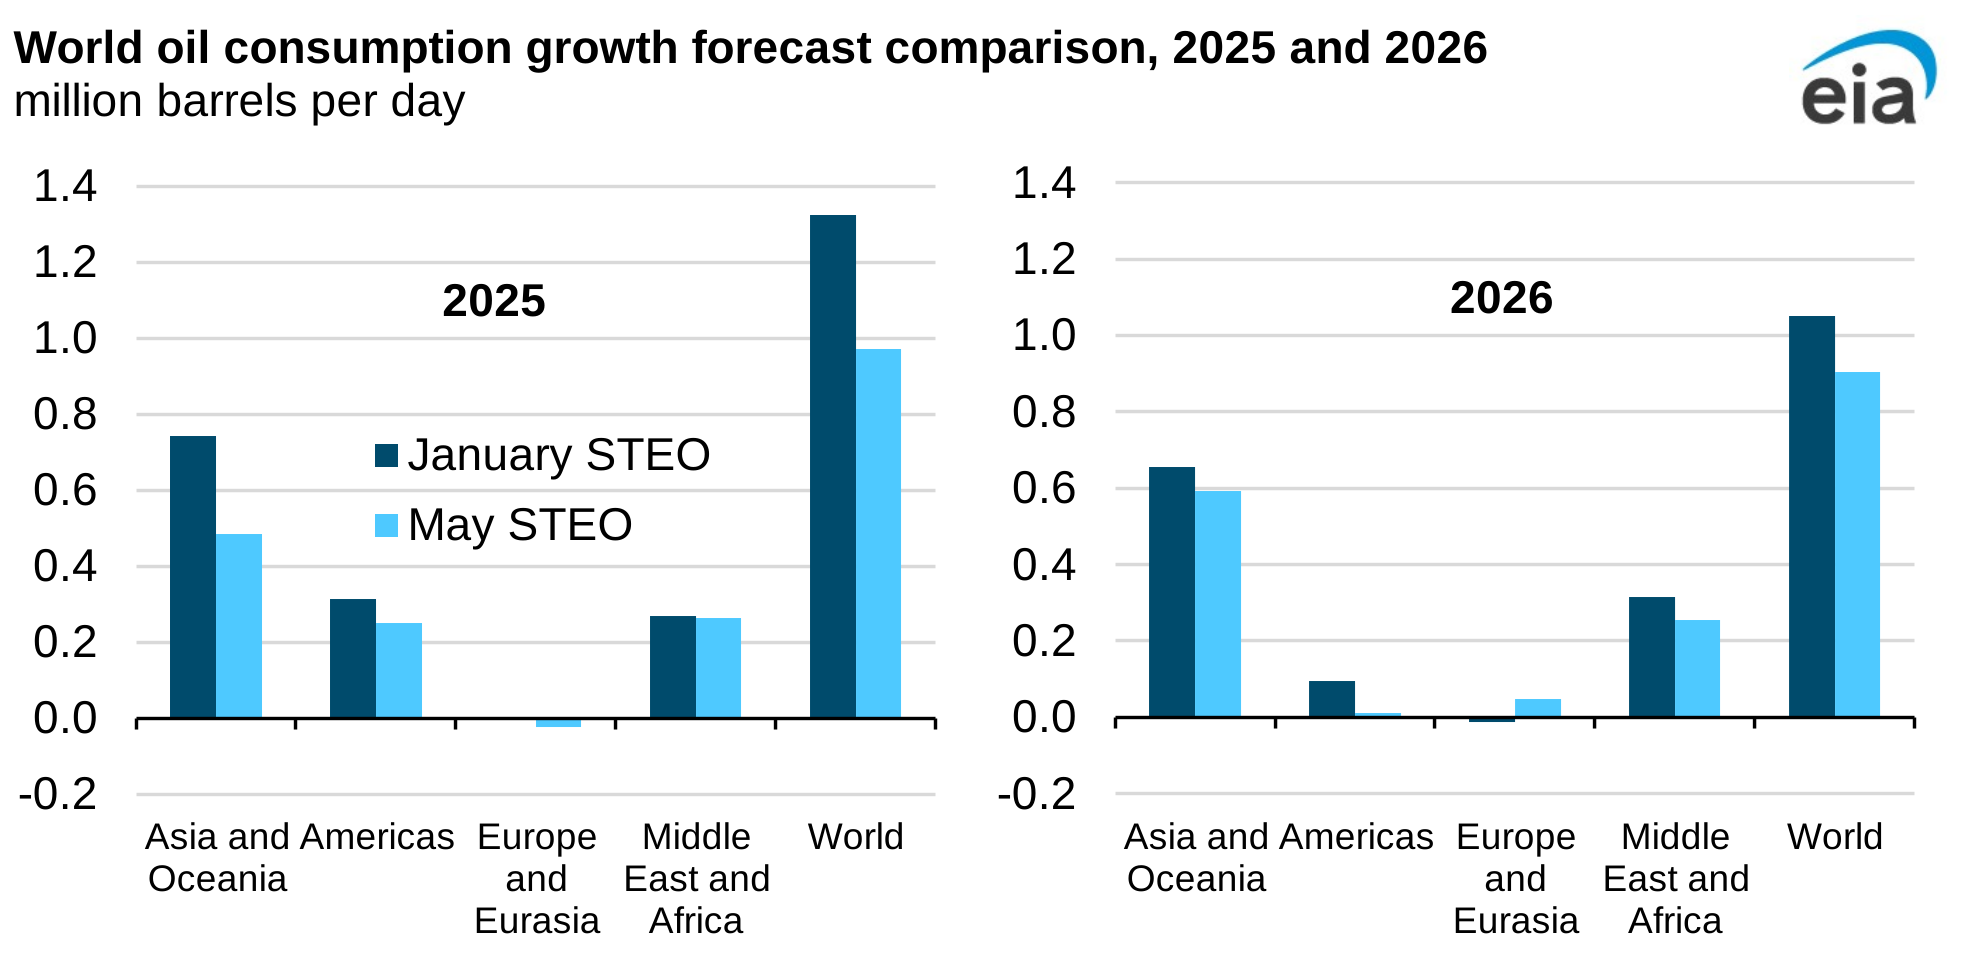
The biggest forecast slowdown in oil consumption growth is in Asia. Compared with our January STEO, when we forecasted oil consumption growth in Asia to average 0.7 million b/d over 2025 and 2026, we now expect consumption growth will slow to average 0.5 million b/d over those years.
We forecast smaller changes in the Americas, Europe, the Middle East, and Africa. Globally, we revised our world oil consumption growth forecasts down by 0.4 million b/d from the January STEO for 2025 and by 0.1 million b/d for 2026.
Our forecast remains highly uncertain and subject to change. Leading economic indicators including vessel traffic, truck tonnage, and airport passenger throughput can provide insight into real-time economic activity and provide clues to global oil consumption trends. Market participants can also follow our Weekly Petroleum Status Report for trends in U.S. petroleum consumption (as measured by product supplied). The United States accounts for about one-fifth of world oil consumption.
Principal contributor: Jeff Barron