
Canada’s oil production drops to its lowest level since 2016 wildfires
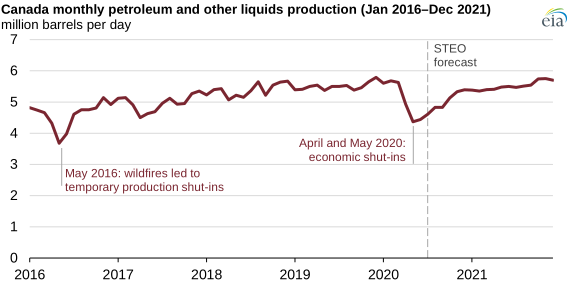
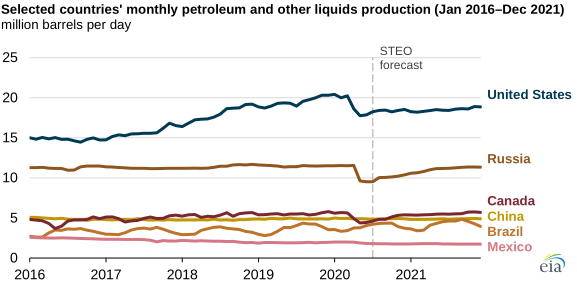
Canada was the world’s fourth-largest producer of petroleum and other liquids in 2019, but in the first half of 2020, Canada’s production declined 20% from its 2019 average of 5.5 million barrels per day (b/d). Canada’s production of petroleum and other liquids declined as a result of low global crude oil prices, reduced demand for crude oil for refined petroleum products in Canada and the United States, and continued production curtailments imposed by the government of Alberta—the province where more than 80% of Canada’s 2019 crude oil production was located.
Canada produced about the same amount of petroleum and other liquids in 2019 as it did in 2018. In late 2018, Western Canadian Select crude oil was trading at historically low prices. The government of Alberta imposed production curtailments in early 2019 to reduce associated bitumen production and to alleviate increasing crude oil inventories and growing constraints on export pipeline takeaway capacity. These restrictions were scheduled to be lifted at the end of 2019, but in October 2019, the restrictions were extended through the end of 2020.
The U.S. Energy Information Administration (EIA) estimates that Canada’s production of petroleum and other liquids fell from 5.6 million b/d in March 2020 to 4.9 million b/d in April, down 700,000 b/d. This decline is similar to the 640,000 b/d decline from April to May 2016, when wildfires in the Fort McMurray area forced a temporary shutdown of some oil sands projects in Alberta.
In the July 2020 Short-Term Energy Outlook (STEO), EIA estimated that Canada’s production fell by an additional 560,000 b/d to 4.4 million b/d in May, the lowest production since mid-2016. EIA estimates Canada’s production increased slightly in June, as demand for petroleum products in Canada and United States also increased.
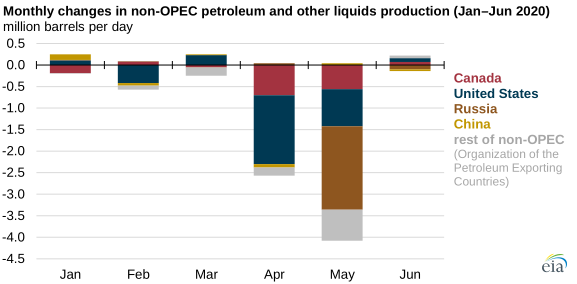
Canada’s decline in the production of petroleum and other liquids in May was greater than declines in total petroleum and other liquids production for some countries that are members of the Organization of the Petroleum Exporting Countries (OPEC). Canada also reduced production more than most of the 10 countries that voluntarily coordinate their production with OPEC (OPEC+). Among non-OPEC producers, Canada’s production declines were the third largest after Russia and the United States.
In the July STEO, EIA forecasts that Canada’s production will remain less than its 2019 average through the remaining months of 2020 and the first half of 2021 as lingering effects of lower global petroleum demand persist. EIA forecasts that Canada’s production of petroleum and other liquids will average 5.1 million b/d in 2020 and 5.5 million b/d in 2021.
Principal contributors: Natalie Kempkey, ShaMyra Sylvester
Tags: production/supply, liquid fuels, Canada, oil/petroleum