
Low transportation fuel demand and low profitability drive refinery run declines
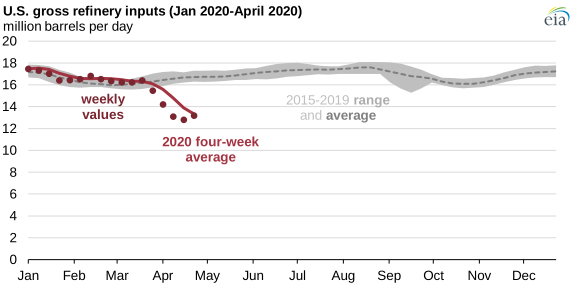
Transportation fuel demand has decreased since early March 2020 as a result of reduced economic activity and stay-at-home orders aimed at slowing the spread of the 2019 novel coronavirus disease (COVID-19). U.S. refineries have reduced the amount of crude oil and other inputs that they process (also known as refinery runs). U.S. refinery runs fell for four consecutive weeks, reaching 12.8 million barrels per day (b/d) in the week ending April 17, and increased slightly to 13.2 million b/d for the week ending April 24, or nearly 21% lower than the previous five-year average for this time of year.
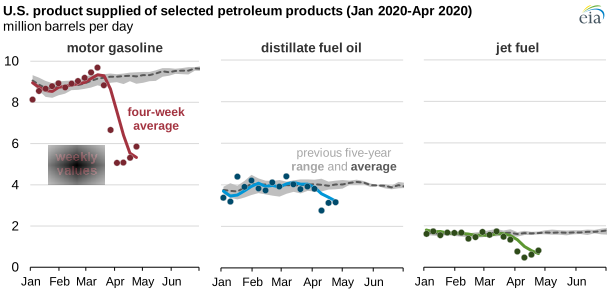
From March 13 (when a national emergency was declared in the United States) to April 24, finished motor gasoline consumption (measured as product supplied) fell to 5.1 million b/d in the week ending April 3, the least product supplied recorded since the U.S. Energy Information Administration (EIA) began tracking these data in 1991. In the weeks since then, gasoline product supplied has risen to 5.9 million b/d, or about 37% lower than the previous five-year average for late April.
Jet fuel product supplied set a record low during the week of April 10, falling to 463,000 b/d. Jet fuel product supplied increased during the past two weeks, averaging 800,000 b/d for the week ending April 24, or 51% lower than the previous five-year average.
Initially, demand for distillate was not as affected as demand for motor gasoline and jet fuel. From March 13 to April 3, distillate fuel product supplied remained within the previous five-year range. Since April 3, however, distillate product supplied fell to its lowest level in 21 years of 2.8 million b/d for the week of April 10. Since then, distillate fuel product supplied has increased slightly and averaged 3.2 million b/d for the week ending April 24.
Distillate fuel oil is primarily consumed as diesel fuel, the predominant fuel of the trucking, locomotive, and agricultural sectors. Increased demand for home delivery and distribution of necessary goods and services has likely supported the distillate product supplied. Recent declines in broad economic activity may be reducing overall distillate demand, despite some support from trucking activity.
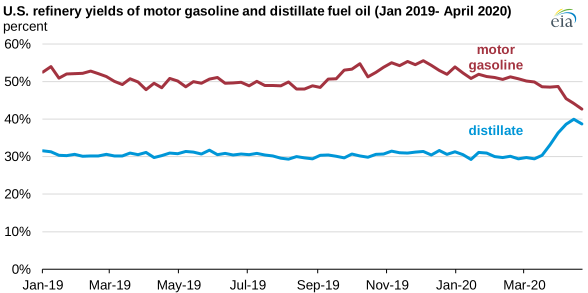
As refinery runs have fallen, refiners have also changed the mix of petroleum products they are producing. Normally (based on the 2019 average), a barrel of crude oil and other inputs will yield 51% motor gasoline, 31% distillate, and 11% jet fuel. U.S. refiners have recently decreased their production of motor gasoline and jet fuel and increased their production of distillate.
U.S. refiner production of motor gasoline fell from 7.9 million b/d for the week ending March 13 to 5.4 million b/d for the week ending April 24. Production of jet fuel fell from 1.6 million b/d to 601,000 b/d during the same period, but production of distillate fuel oil increased from 4.7 million b/d to 4.9 million b/d.
The ratio of distillate production divided by crude oil inputs, also known as the distillate yield, reached 40% for the week ending April 17, the highest percentage yield of distillate since at least 1990 when data on refinery inputs started being collected by EIA. Distillate yields fell slightly, to 39%, in the following week. Motor gasoline yields were at a record low of 43% in the week ending April 24.
Principal contributors: Corrina Ricker, Matt French