
Solar panel shipments set a record high in 2022 as capacity continued to grow
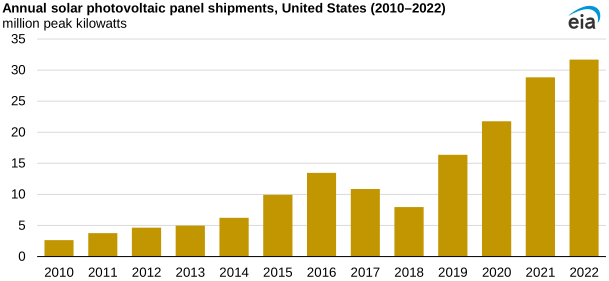
In 2022, solar photovoltaic panel shipments in the United States increased 10% from 2021, setting another annual record (31.7 million peak kilowatts [kWp]), based on our latest published data. U.S. solar panel shipments have been growing as solar capacity continues to rise.
U.S. solar panel shipments closely track domestic solar capacity additions; the difference between the two is usually because of the lag time between when panels are shipped and when they’re installed. U.S. solar panel shipments include imports, exports, and domestically produced and shipped panels. In 2022, about 88% of U.S. solar panel shipments were imports, primarily from Asia.
Over the past decade, U.S. solar capacity has boomed, which includes both utility-scale solar farms (with one megawatt of capacity or more) and small-scale solar. The majority of small-scale solar is residential rooftop solar installations.
In the United States, 10.9 gigawatts (GW) of new utility-scale solar capacity was added in 2022, the second-largest addition in a single year after the record-setting 13.5 GW added in 2021, according to our Annual Electric Generator Report. The United States added 6.4 GW of new small-scale solar capacity in 2022, an annual record and 17% more than was added in 2021 (5.5 GW).
Some of the new solar projects that developers originally planned to bring online last year were canceled or delayed until 2023 because of solar panel supply chain issues. These issues included solar panels stopped at the U.S. border. U.S. Customs and Border Protection (Customs) detained a number of solar panel imports in 2022 as they began enforcing the Uyghur Forced Labor Prevention Act (UFLPA). The UFLPA prohibits importing goods made with forced labor in China’s Xinjiang province. Nearly half of global polysilicon production, an essential material for making solar panels, comes from Xinjiang. Customs released detained panels once importers proved their compliance with UFLPA, but the delay lengthened the timelines for some new solar projects.
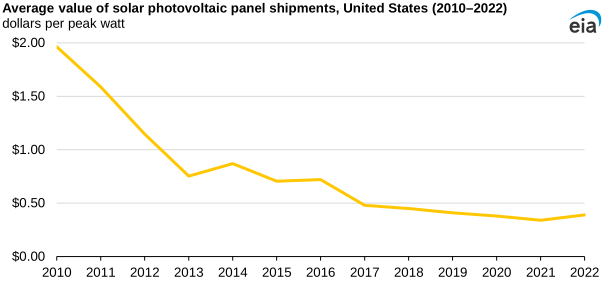
Solar panel costs have dropped significantly since 2010, helping fuel solar capacity growth both in the United States and globally. The average value of U.S. solar panel shipments (a proxy for price) has decreased from $1.96 per peak watt (Wp) in 2010 to $0.39/Wp in 2022. The average value of solar panels shipments increased 15% from 2021, amid rising inflation, higher material and shipping costs, and continued supply chain constraints.
We use peak kilowatts as the unit of measurement in our solar photovoltaic module shipment reports. Peak watts are a manufacturer’s unit indicating the direct current output a photovoltaic module will produce at standard test conditions (normally 1,000 watts per square meter and 25 degrees Celsius).
Principal contributors: Lolita Jamison, Elesia Fasching
Tags: generation, electricity, solar, capacity