
Combined wind and solar made up at least 20% of electric generation in 10 states in 2017
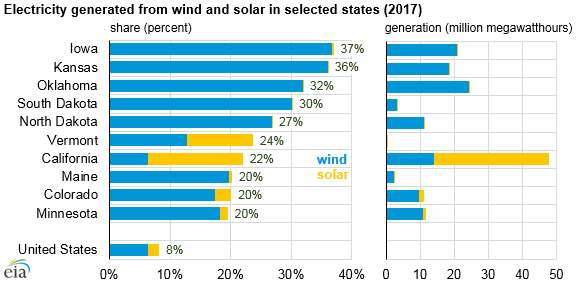
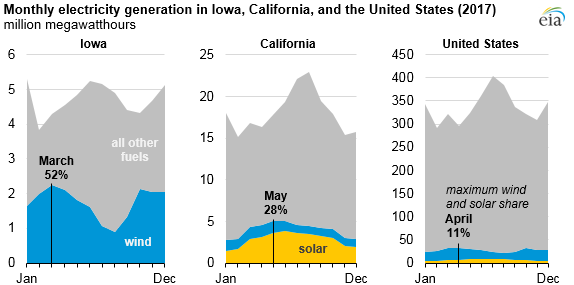
Wind and solar electric generation, including small-scale solar photovoltaics, reached or exceeded 20% of total generation in 10 states in 2017. During some months in 2017, wind accounted for more than 50% of in-state electricity generation in Iowa and Kansas, and solar accounted for more than 20% of in-state electricity generation in California. Total annual generation from wind and solar in the United States in 2017 reached 8% for the year and peaked at 11% in April of that year.
Wind and solar resources are unique among sources of electricity. Unlike most other generating technologies, grid operators generally do not dispatch wind and solar generation because these generators produce electricity only when the associated resources are available. Even so, some wind and solar plants may allow for limited dispatcher control on a minute-to-minute basis. For example, by setting operating levels to slightly lower than achievable levels for current conditions, operators have some flexibility to increase or decrease output in response to market signals.
Other generating technologies that use combustible fuels respond to grid dispatch commands to increase or decrease generation as needed. Some conventional resources such as nuclear may have limited flexibility and cannot adjust output quickly in response to dispatch signals. Conventional hydroelectric generation can be either dispatchable or non-dispatchable. For example, hydroelectric facilities with reservoirs have some control over the dispatch of their electricity, and run of the river generation is non-dispatchable because it generates electricity as water passes through it. Hydro facilities can also have seasonal limits on dispatch based on available water resources.
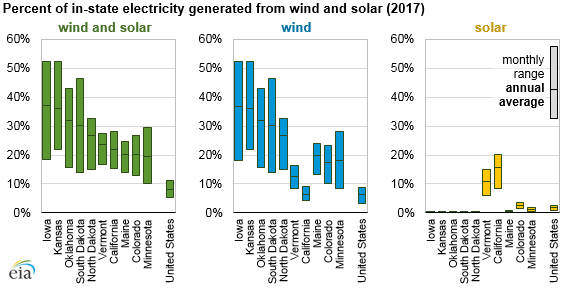
The highest share of combined monthly wind and solar in-state electricity generation exceeded 50% in Iowa and Kansas. The share of wind and solar generation is often highest in either fall or spring, when demand for electricity is relatively low. Generation from solar tends to peak during the summer months.
Of the 10 states with the highest shares of wind and solar generation, almost all of them are driven by wind generation. For example, Iowa has annual wind and solar generation of 37% (36.8% wind and 0.2% solar). In some states, such as California, Nevada, Massachusetts, and Arizona, solar generation is higher than wind generation. California’s annual solar share was 15.6%, compared with 6.4% for wind. In May of 2017, California’s wind and solar share reached 28% of in-state electricity generation.
The shares in this article reflect the portions of the total utility-scale electricity and small-scale solar photovoltaic electricity generated in each state. Because the electric system in the Lower 48 states essentially operates as three large interconnections, the electricity generated in one state may be consumed in another.
Principal contributor: Cara Marcy
Tags: generation, electricity, wind, solar, California, states, Iowa