
United States on track for record natural gas production in 2026

Note: 1H2026=first half of 2026
We forecast U.S. marketed natural gas production will average 122.5 billion cubic feet per day (Bcf/d) in 2026, surpassing the previous record of 118.5 Bcf/d set in 2025, in our August 2026 Short-Term Energy Outlook (STEO).
In the first half of 2026 (1H26), marketed natural gas production averaged 121.3 Bcf/d, 4% (4.6 Bcf/d) more than the same period in 2025. Most of this expansion is concentrated in the Permian region in Texas and New Mexico and the Haynesville region in Louisiana and Texas.
The United States was the world’s largest producer of natural gas from 2009 through 2024, the most recent year for which we have global natural gas production data.
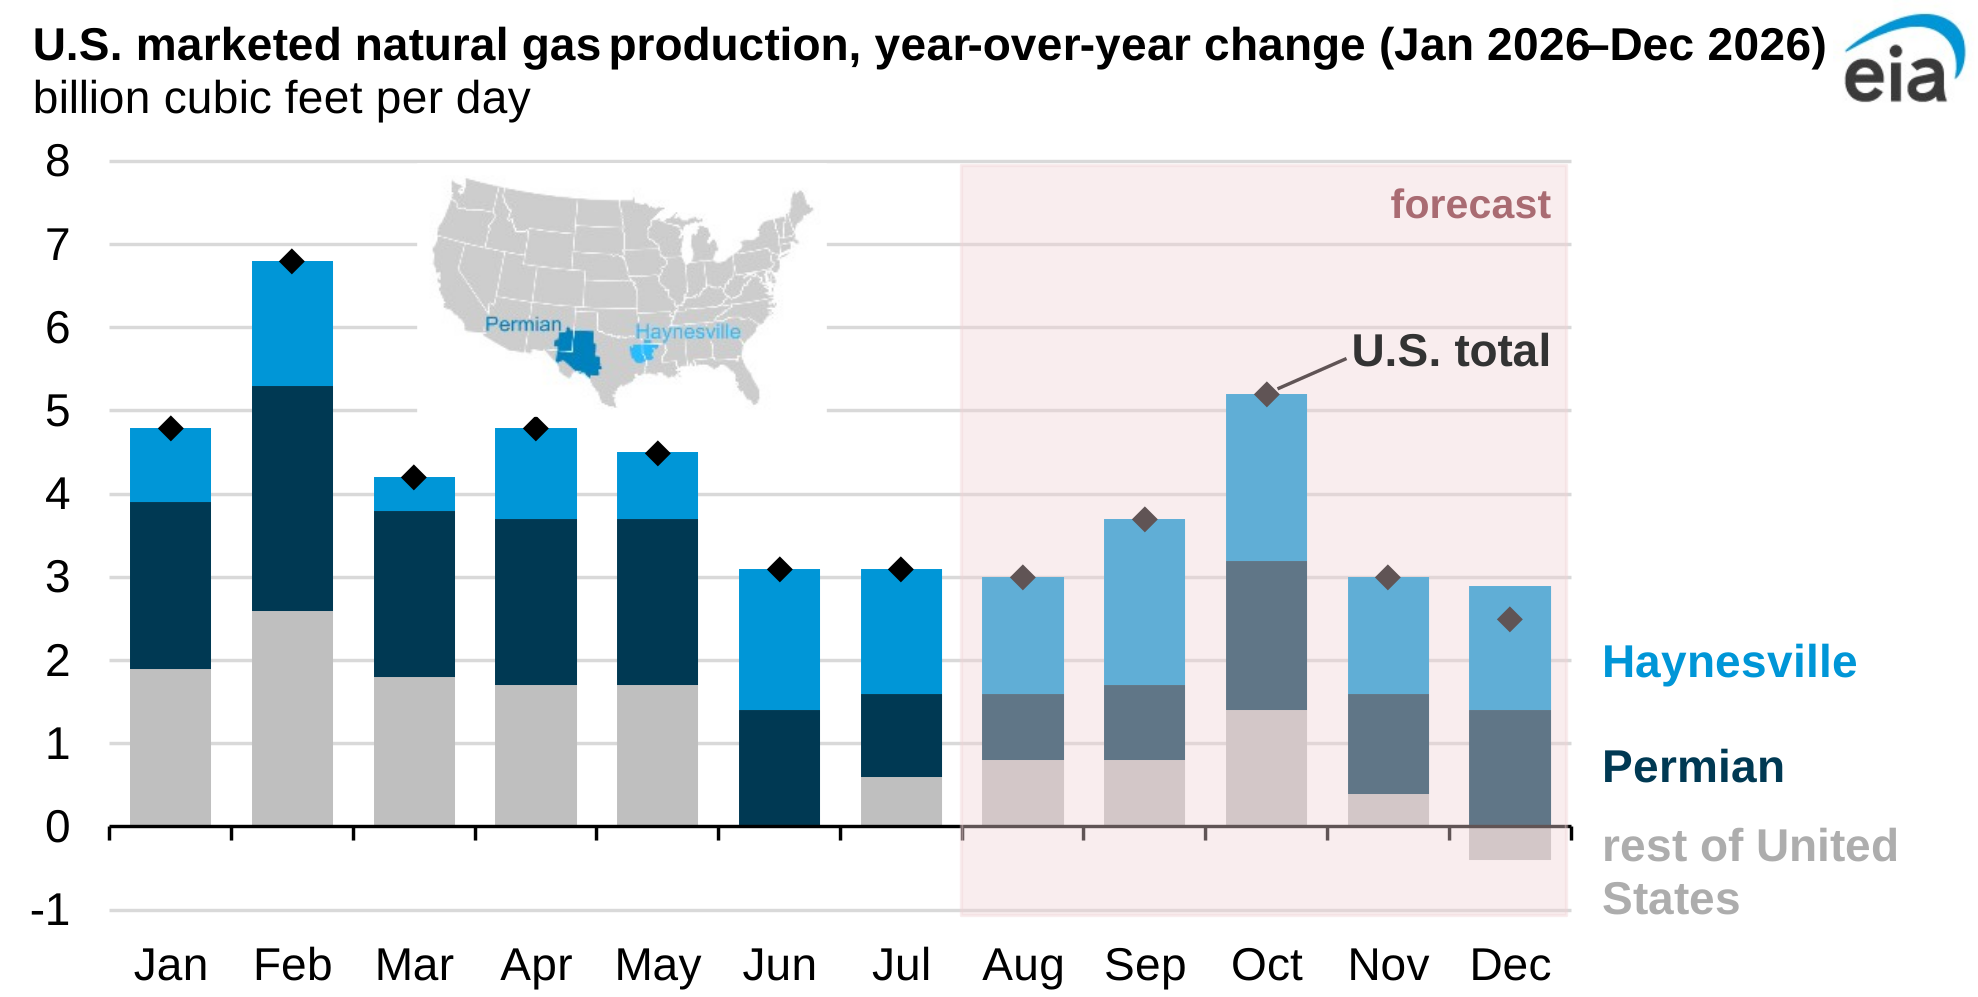
We forecast Permian gas production will average 29.2 Bcf/d in 2026, 6% more than in 2025. In the Permian region, natural gas production is driven primarily by associated gas produced during crude oil extraction and is supported by crude oil prices.
West Texas Intermediate (WTI) crude oil prices rose from an average of $65/barrel (b) in 2025 to an average of $84/b through July 2026, exceeding the region’s breakeven price—the minimum price needed for an operation to cover its costs. Oil industry executives responding to the Dallas Fed Energy survey reported the two largest basins in the Permian had breakeven prices of $69/b (Midland Basin) and $63/b (Delaware Basin) in 2026. The relatively high prices support oil-directed drilling in the Permian region and the resulting rise in both crude oil and natural gas production.
In addition to crude oil prices, a steadily increasing gas-to-oil ratio (GOR) in the Permian is contributing to growth in Permian natural gas production. As more oil and natural gas are produced, pressure within the reservoir declines. Natural gas is easier to produce at lower pressures than oil, so the GOR increases.
In the Haynesville region, natural gas production increased by 1.1 Bcf/d (7%) in 1H26 compared with 1H25. We forecast Haynesville natural gas production will increase 9% (1.3 Bcf/d) in 2026. Drilling in the Haynesville formation—which, at 10,500 feet to 13,500 feet deep, is one of the deepest in the U.S. Lower 48 states—has higher development costs associated with drilling deeper wells. Unlike Permian operators who drill mostly for oil, Haynesville operators drill mostly for natural gas. So, Haynesville production is driven by the natural gas benchmark Henry Hub price.
We forecast the Henry Hub spot price will fall by 2% (8 cents) to average $3.44 per million British thermal units in 2026. At this forecast price, drilling in the Haynesville remains economical despite the relatively deeper wells and more expensive development costs. In addition, the Haynesville’s proximity to liquefied natural gas export terminals and major industrial natural gas consumers along the U.S. Gulf Coast draws operators to actively drill in the region.
Principal contributors: Trinity Manning-Pickett, Naser Ameen