
China’s crude oil imports fell in the second quarter

China, the world’s largest importer of crude oil, imported less crude oil in the second quarter of 2026 (2Q26) following higher crude oil prices that resulted from disrupted flows through the Strait of Hormuz. China’s lower imports reduced global demand, softening the upward price effects from the disrupted supply through the strait.
Monthly data from China’s General Administration of Customs indicate that China imported just 8.1 million barrels per day (b/d) of crude oil in 2Q26, 32% less than the previous quarter. In May and June, imports fell below 8.0 million b/d for the first time since 2016.
China’s recent decrease in crude oil imports contrasts with record-high imports before the conflict around the Strait of Hormuz. China imported an annual record of 11.6 million b/d of crude oil in 2025, expanding its strategic oil stocks at a time when crude oil prices were the lowest since 2020. In 2H25, when crude oil prices were lowest, China imported an average of 12.0 million b/d, a level sustained through February 2026.
Most crude oil imports into China arrive by tanker, and tanker traffic data from Vortexa suggest the decrease in imports was from waterborne movements rather than pipeline imports, which we estimate remained stable. The largest decreases in waterborne imports between 1Q26 and 2Q26 were from Iraq (910,000 b/d), Russia—China’s top source of imports—(640,000 b/d), and the UAE (600,000 b/d).
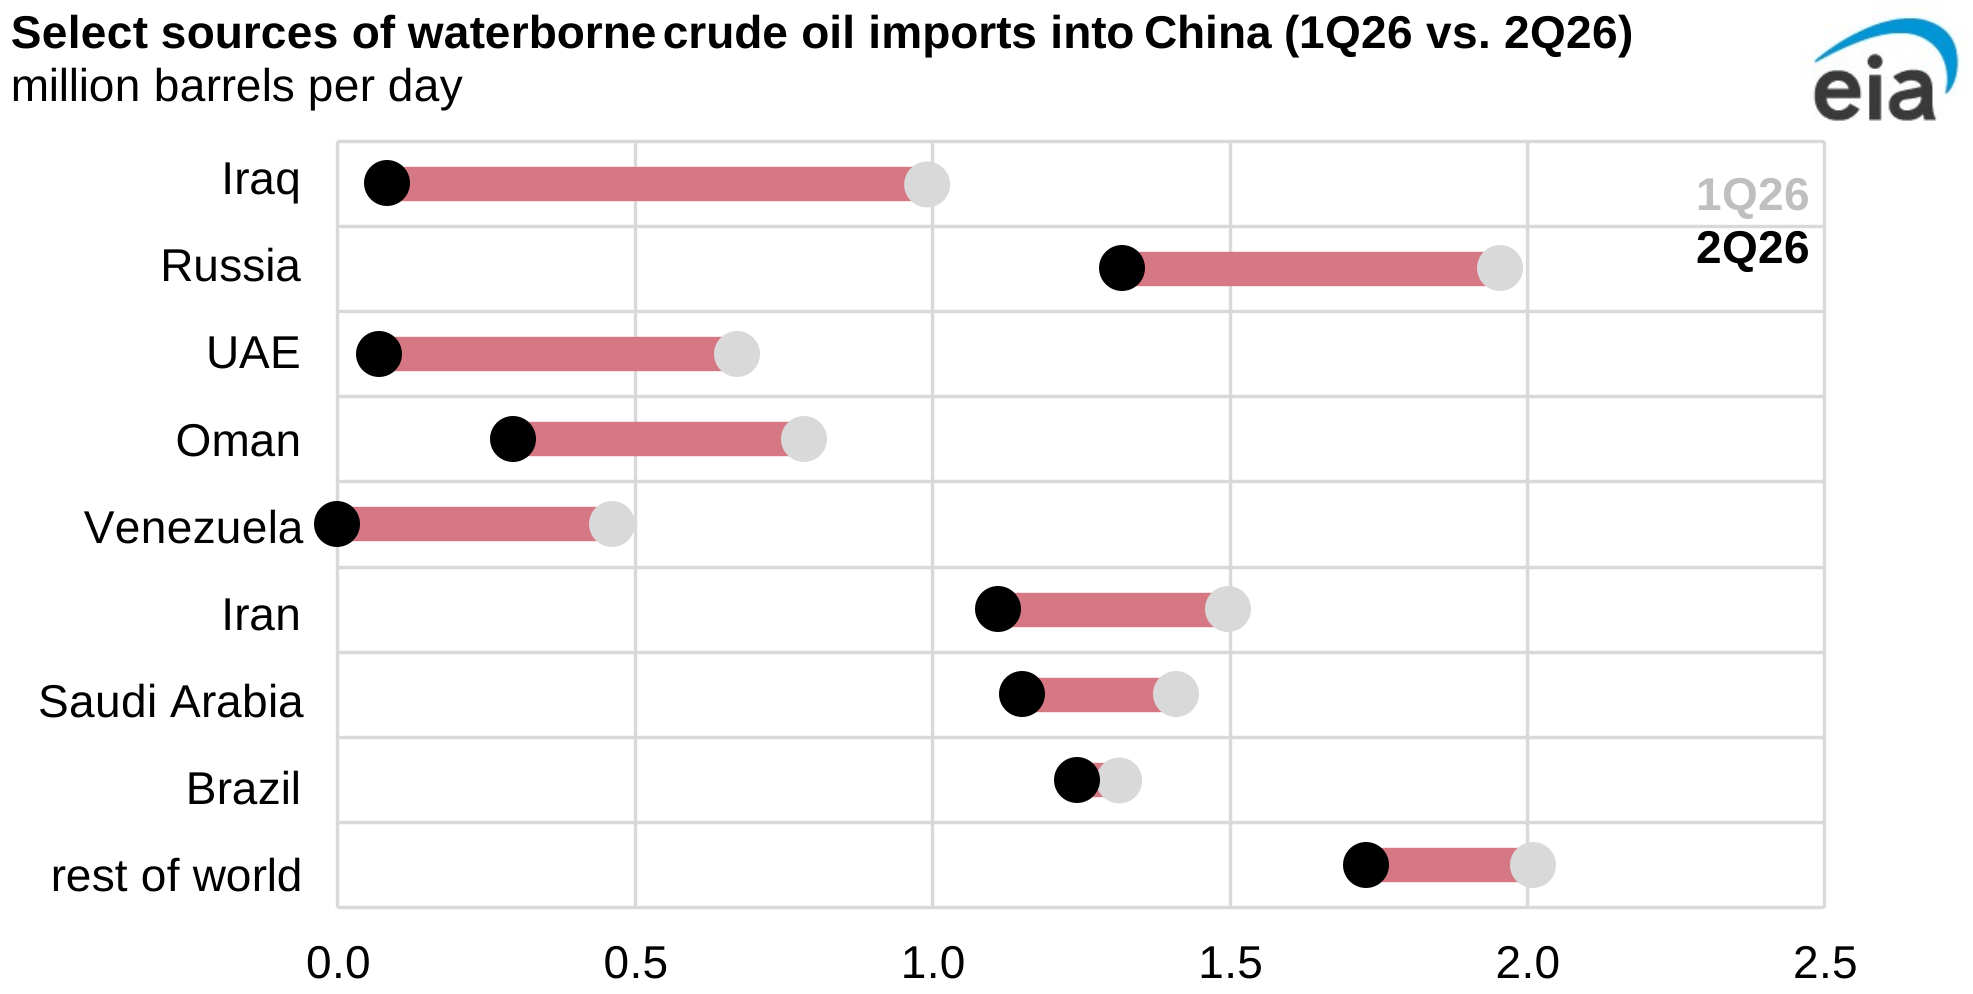
Note: China also imports crude oil via pipeline from Russia.
China reduced its imports of crude oil more than refiners reduced processing crude oil, suggesting crude oil inventory draws. China’s refineries processed 2.2 million b/d less crude oil in 2Q26 than in 1Q26, compared with a 3.9 million b/d drop in imports.
In 2Q26, we estimate record-high global inventory draws of 5.1 million b/d that would have been even larger if global demand hadn’t decreased.
Principal contributor: Jimmy Troderman
Tags: China, crude oil, exports/imports