
U.S. natural gas storage capacity increased in 2024

Note: Measures of capacity reflect final revised values as published in the Underground Natural Gas Working Storage Capacity report.
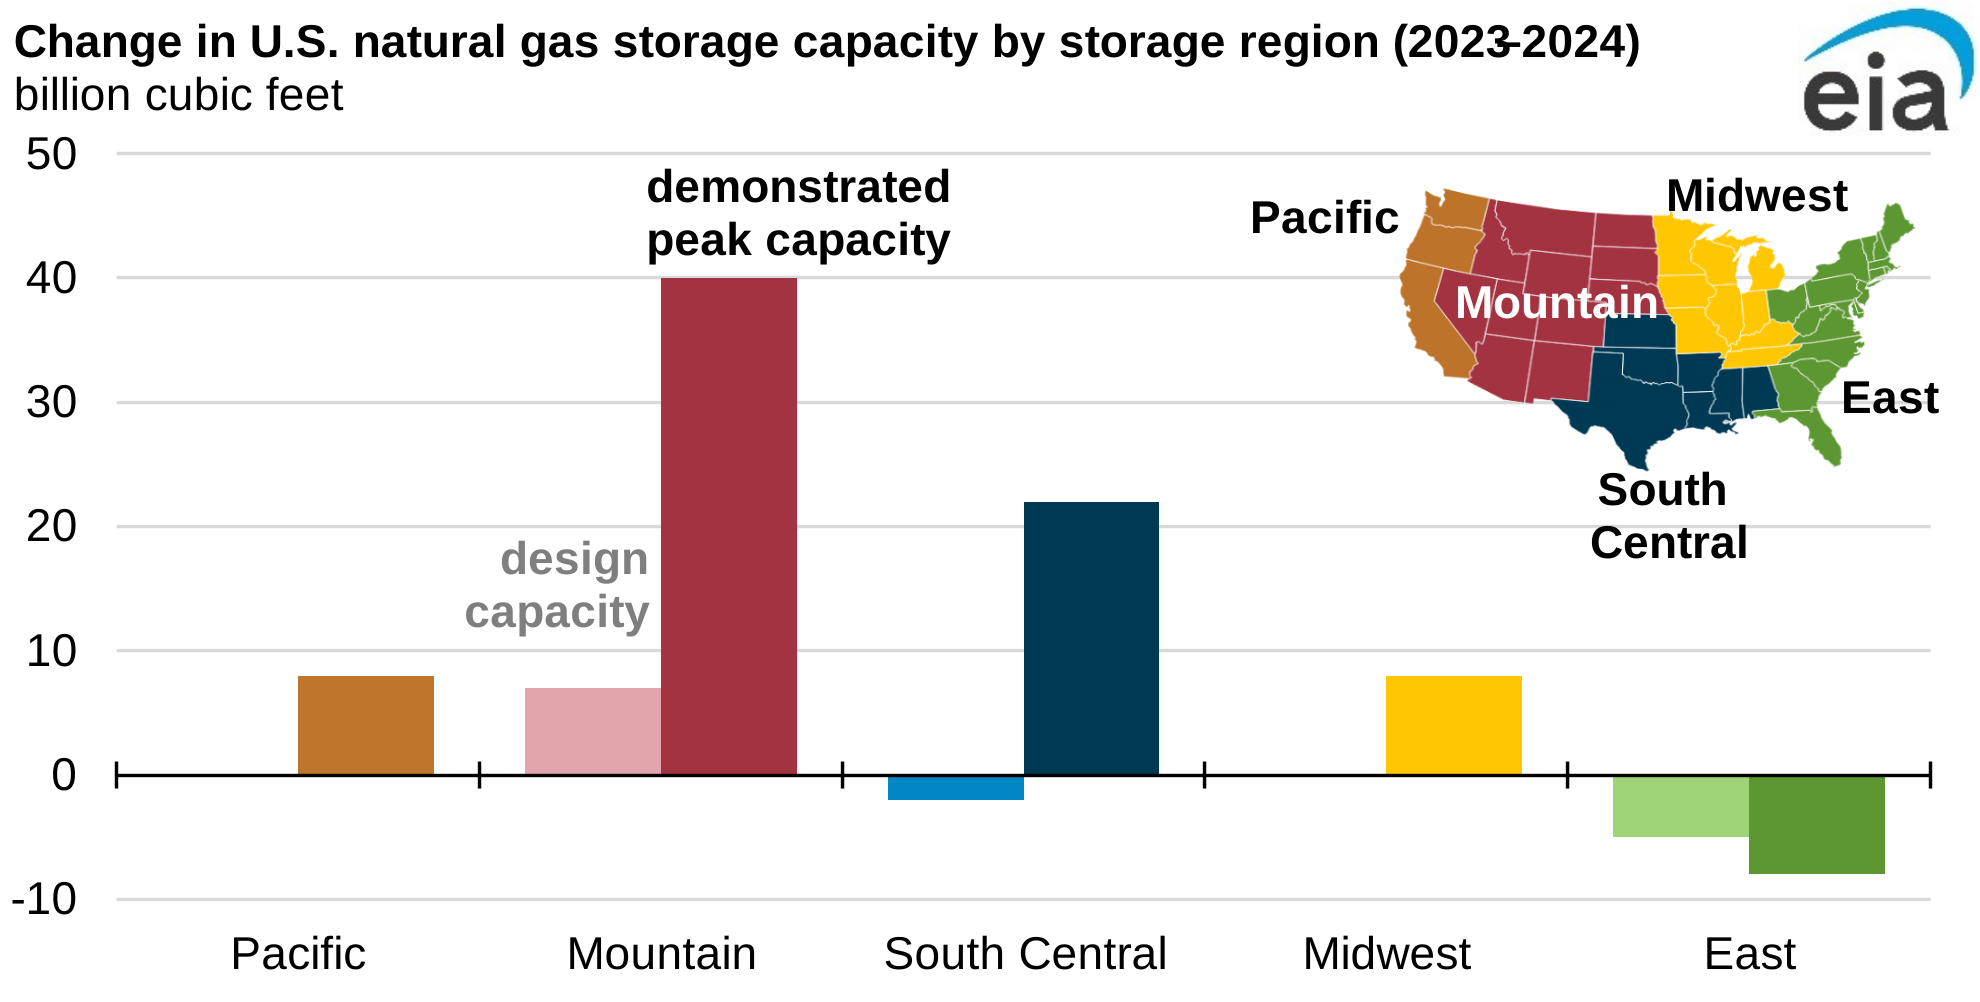
Underground working natural gas storage capacity in the Lower 48 states increased in 2024 according to our latest data. We calculate natural gas storage capacity in two ways: demonstrated peak capacity and working gas design capacity. Both increased in 2024. Underground natural gas storage provides a source of energy when demand increases, balancing U.S. energy needs. In 2024, demonstrated peak capacity rose 1.7%, or 70 billion cubic feet (Bcf), to 4,277 Bcf, while working gas design capacity increased slightly by 0.1%, or 3 Bcf.
Demonstrated peak capacity is the sum of the largest volume of working gas stored in each storage field during the previous five-year period, regardless of when the peaks occurred. Demonstrated peak capacity is typically less than working gas design capacity because it relates to actual usage rather than potential capacity based on the design of the facility.
In 2024, demonstrated peak capacity increased in four of the five storage regions of the Lower 48 states. The increased demonstrated peak capacity reflected both greater utilization of existing facilities and expansions of existing infrastructure. The largest increase in demonstrated peak capacity was in the Mountain region, where colder-than-normal temperatures during the 2023–24 winter required more working gas in storage to meet winter demand, resulting in increased injection activity during the subsequent months. In California, the California Public Utilities Commission increased the authorized working gas capacity at the Aliso Canyon facility by 67% to 69 Bcf in late August 2024. This regulatory change contributed to increased demonstrated peak capacity in the Pacific region.
The working gas design capacity of a natural gas storage field measures the theoretical capacity of a facility based on physical characteristics of the reservoir, installed equipment, and operating procedures, which are often certificated by federal or state regulators.
Total U.S. working gas design capacity increased slightly in 2024. Working gas design capacity increased 7 Bcf in the Mountain region, offsetting declines elsewhere in the Lower 48 states. In the South Central region, working gas design capacity declined slightly in 2024 primarily due to base gas adjustments in the region. The East region also saw a decline primarily due to base gas adjustments (of 5 Bcf), which reduced the amount of capacity available for working gas storage. The increases in base gas—coupled with no changes in total design capacity—had the effect of reducing working gas capacity at these facilities.
Note: Measures of capacity reflect final revised values as published in the Underground Natural Gas Working Storage Capacity report.
For the most up-to-date weekly data and regional breakdowns on U.S. underground natural gas storage, readers can visit EIA’s Natural Gas Storage Dashboard.
Principal contributors: Jose Villar, Eulalia Munoz-Cortijo
Tags: natural gas, storage capacity, storage