
U.S. inventories enter the winter with the most natural gas since 2016
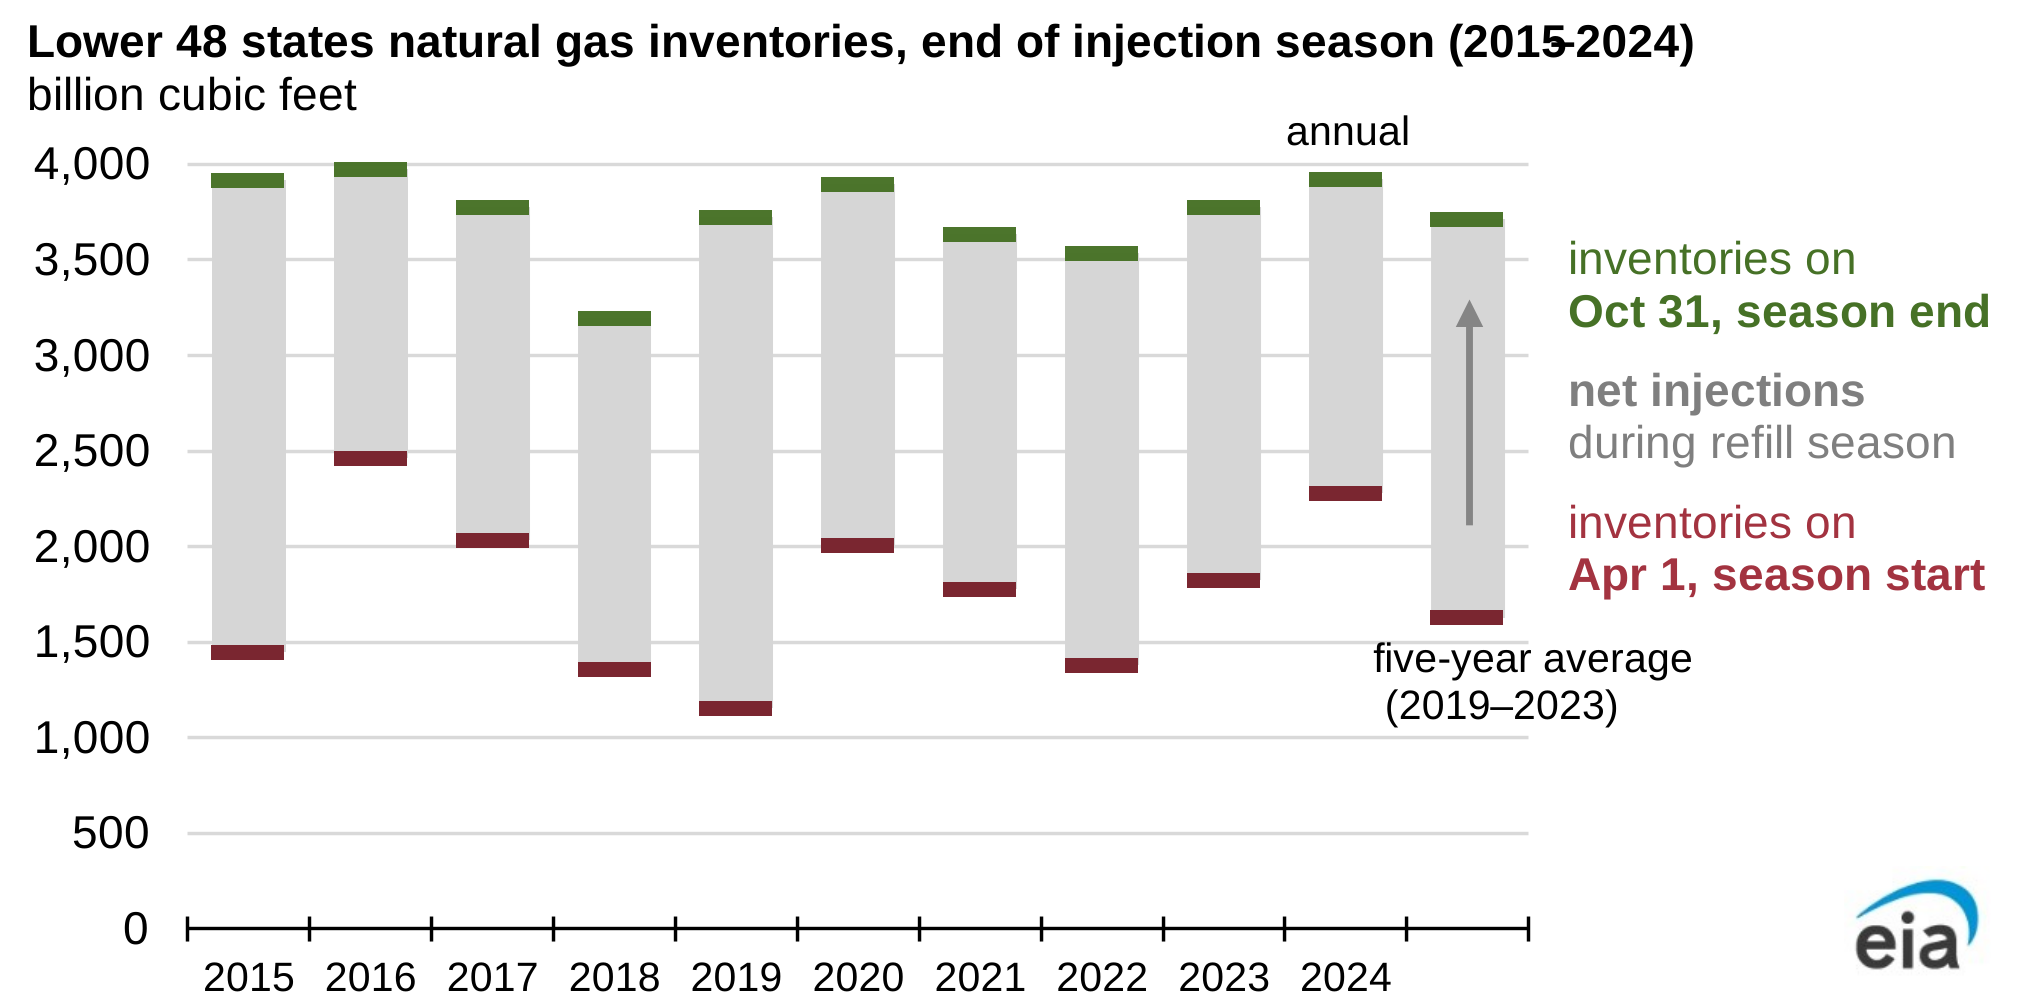
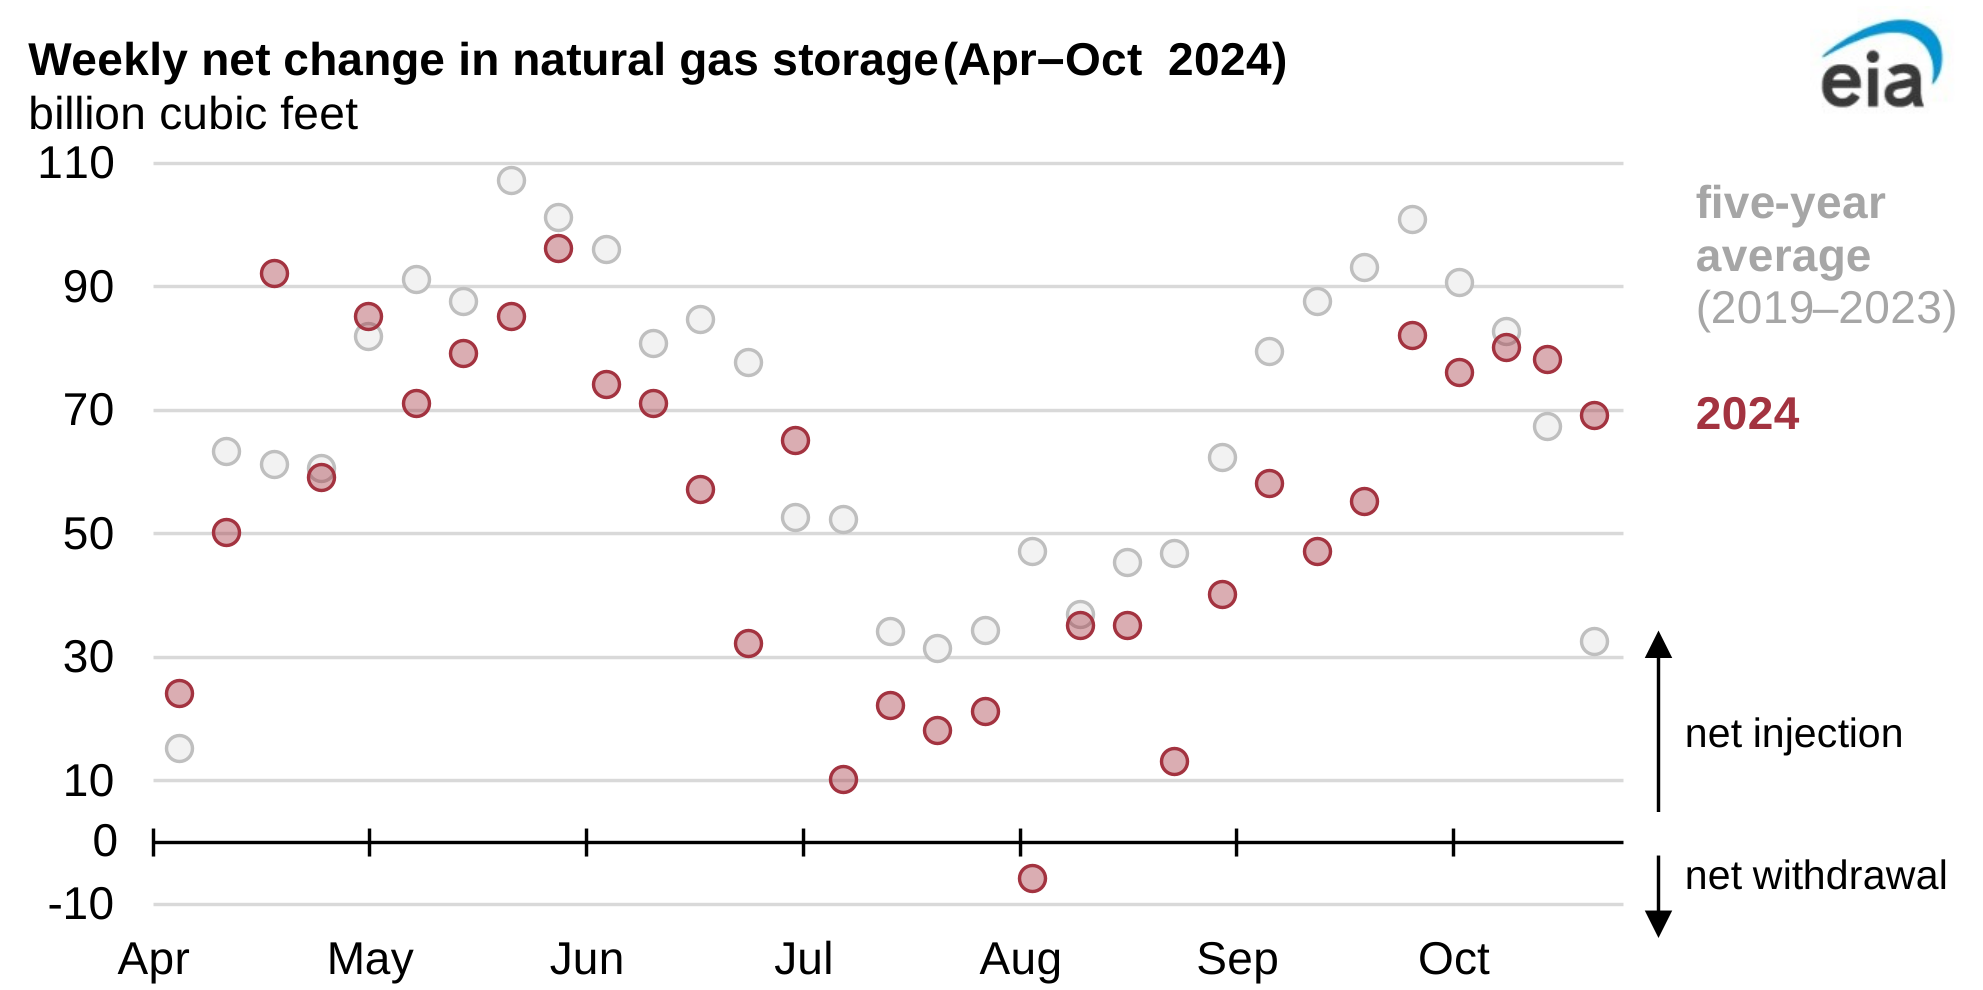
Working natural gas in storage in the Lower 48 states ended the natural gas injection season with 3,922 billion cubic feet (Bcf), according to estimates based on data from our Weekly Natural Gas Storage Report released on November 7. U.S. inventories are starting winter 2024–25 with the most natural gas since 2016. Inventories are currently 6% above the five-year (2019–23) average, despite less-than-average injections into storage throughout the entire injection season, which runs April 1 through October 31. Less natural gas than the five-year average was injected in nearly every week during the 2024 injection season, in part because starting inventories were relatively full.
Natural gas inventories in the Lower 48 states at the end of March 2024 (the end of withdrawal season) totaled 2,282 Bcf, 25% more than at the same time in 2023 and 40% more than the five-year average for March. This enabled storage operators to reach their end-of-season targets with smaller natural gas injections. Low natural gas prices in 2024 encouraged producers to curtail production, which also reduced natural gas available for injections.
Net injections into natural gas storage during the injection season totaled 1,640 Bcf, 21% less than the five-year average. Weekly injections ranged from a maximum of 96 Bcf in late May to 10 Bcf in mid-July. Although natural gas is typically injected into storage in the summer, withdrawals occasionally occur, particularly in the Pacific and South Central regions. The U.S. South Central region has exhibited a unique seasonal pattern in recent years with weekly net natural gas withdrawals following early summer injections, particularly at the salt dome facilities, to meet summer cooling demand. For the week ending August 9, withdrawals in the South Central region and Pacific region combined totaled 29 Bcf, with a net withdrawal of 6 Bcf from U.S. natural gas storage, the first net withdrawal from U.S. storage during the summer since July 2016.
Natural gas injections into storage for the weeks ending October 25 and November 1 (the last two weeks of injection season) exceeded their five-year averages, further boosting the volume of natural gas in storage. In our November Short-Term Energy Outlook, we forecast natural gas withdrawals during the 2024–25 heating season will total 1,957 Bcf and that inventories will be 6% above the five-year (2020–24) average at the end of March 2025.
Principal contributors: Grace Wheaton, Katy Fleury, Jose Villar
Tags: inventories/stocks, weather, natural gas, storage