
Canada's crude oil has an increasingly significant role in U.S. refineries
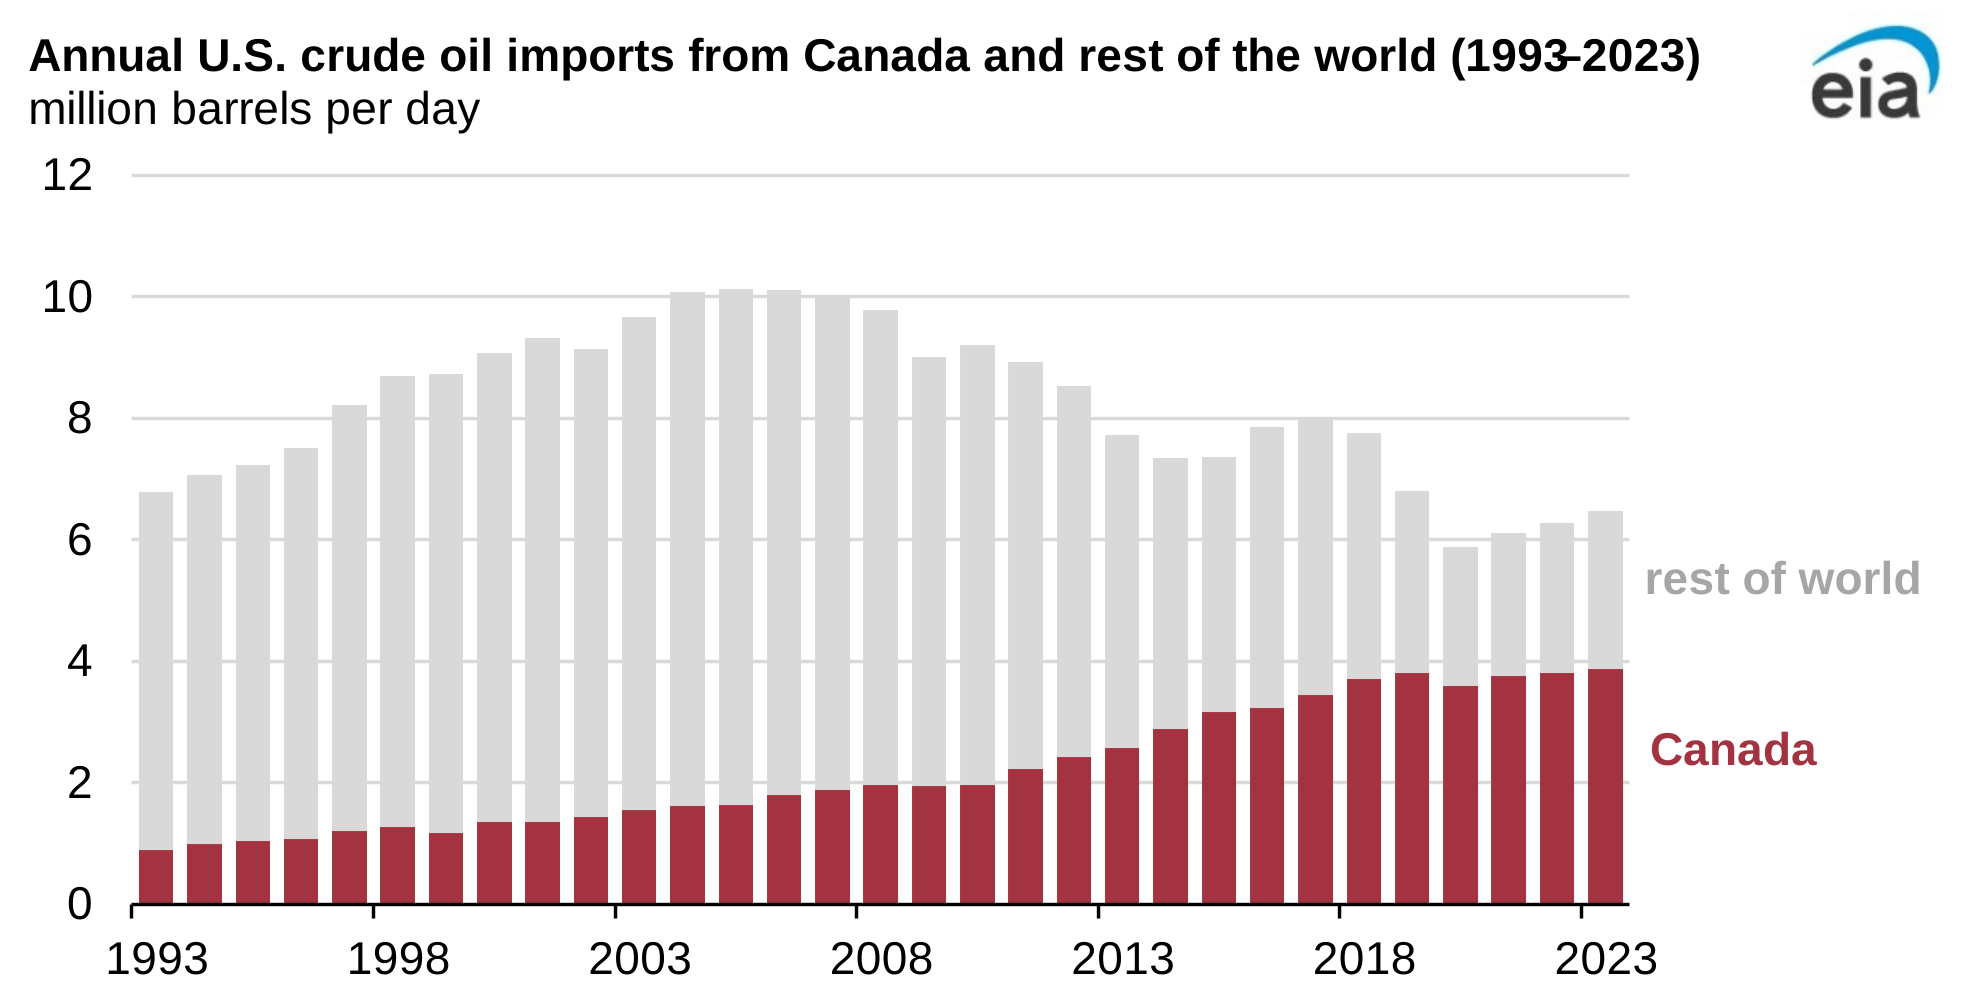
Crude oil imports from Canada have become increasingly important to U.S. oil refineries, now making up most U.S. imports. U.S. oil refining capacity stood at 18.4 million barrels per day (b/d) as of January 1, 2024. In 2023, 60% of U.S. crude oil imports originated in Canada, up from 33% in 2013.
As crude oil production has increased in Canada, so have exports to the United States. Imports from Canada to the United States grew by an average of 4% in every year from 2013 to 2023. Canada’s crude oil exports to the United States amounted to 24% of U.S. refinery throughput in 2023, an increase from 17% in 2013.
Crude oil production averaged 4.6 million b/d in Canada during 2023, nearly three times the country’s 1.7 million-b/d refinery capacity. Many U.S. refineries are designed to handle heavy oils like those produced in Canada’s oil sands, yielding refined products such as transportation fuels (gasoline and diesel), chemicals, and plastics.
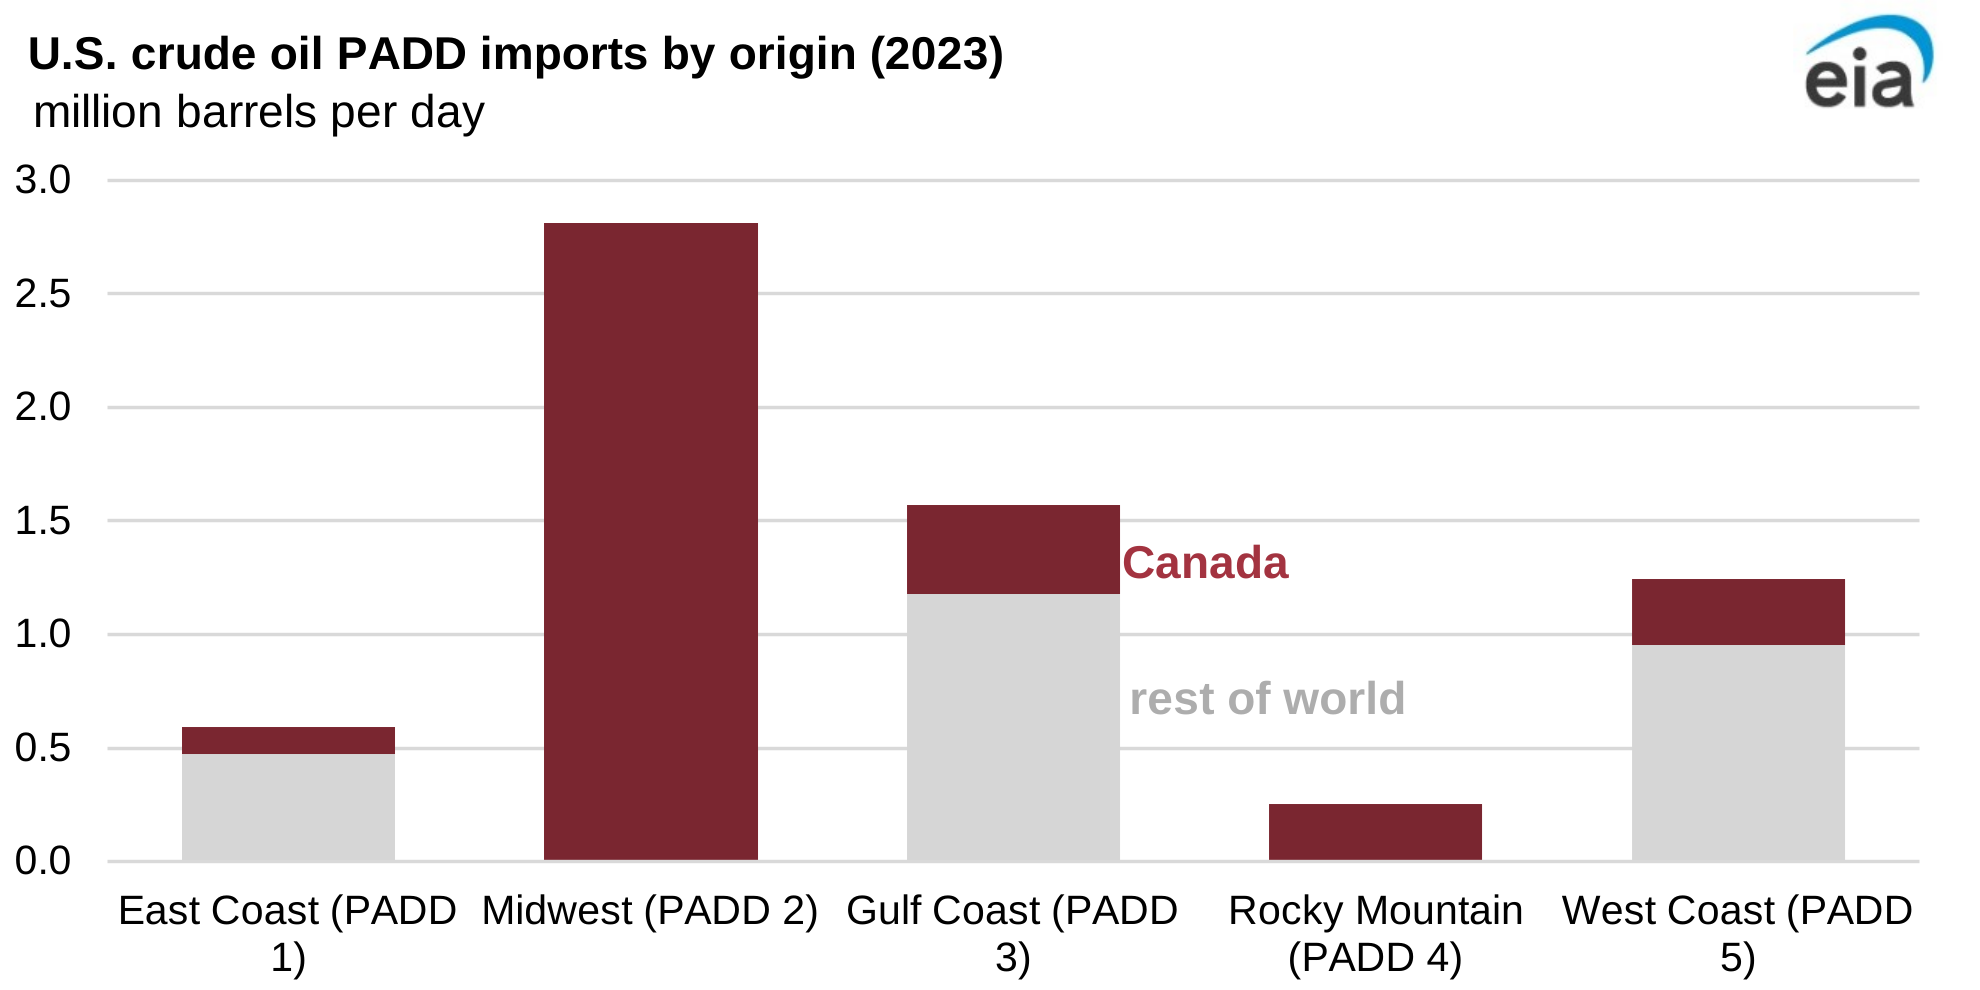
Note: The Petroleum Administration for Defense Districts (PADDs) are geographic aggregations of the 50 states and the District of Columbia into five districts: PADD 1 is the East Coast, PADD 2 the Midwest, PADD 3 the Gulf Coast, PADD 4 the Rocky Mountain region, and PADD 5 the West Coast.
Geographic proximity allows Canada’s pipelines to transport crude oil from the western provinces, mainly from Alberta’s large crude oil production region, to refineries in the United States. Inland regions of the United States, particularly the Midwest (PADD 2) and Rocky Mountains (PADD 4), are closely connected to Canada’s oil markets via pipeline and rail networks. Additional takeaway capacity exists for shipments to the Gulf Coast (PADD 3).
Pipeline capacity to carry Canada’s crude oil exports has increased in recent years. In 2020, the Express Pipeline’s capacity was expanded from 287,000 b/d to 310,000 b/d, allowing producers to increase oil sands exports from Western Canada to U.S. Rockies region refineries. In May 2024, the Trans Mountain Expansion Project (TMX) became operational, nearly tripling the pipeline capacity to Canada's Pacific Coast to 890,000 b/d. The expansion project aims to increase Canada’s crude oil producers’ access to global markets, alleviating bottlenecks and driving higher oil production in Canada.
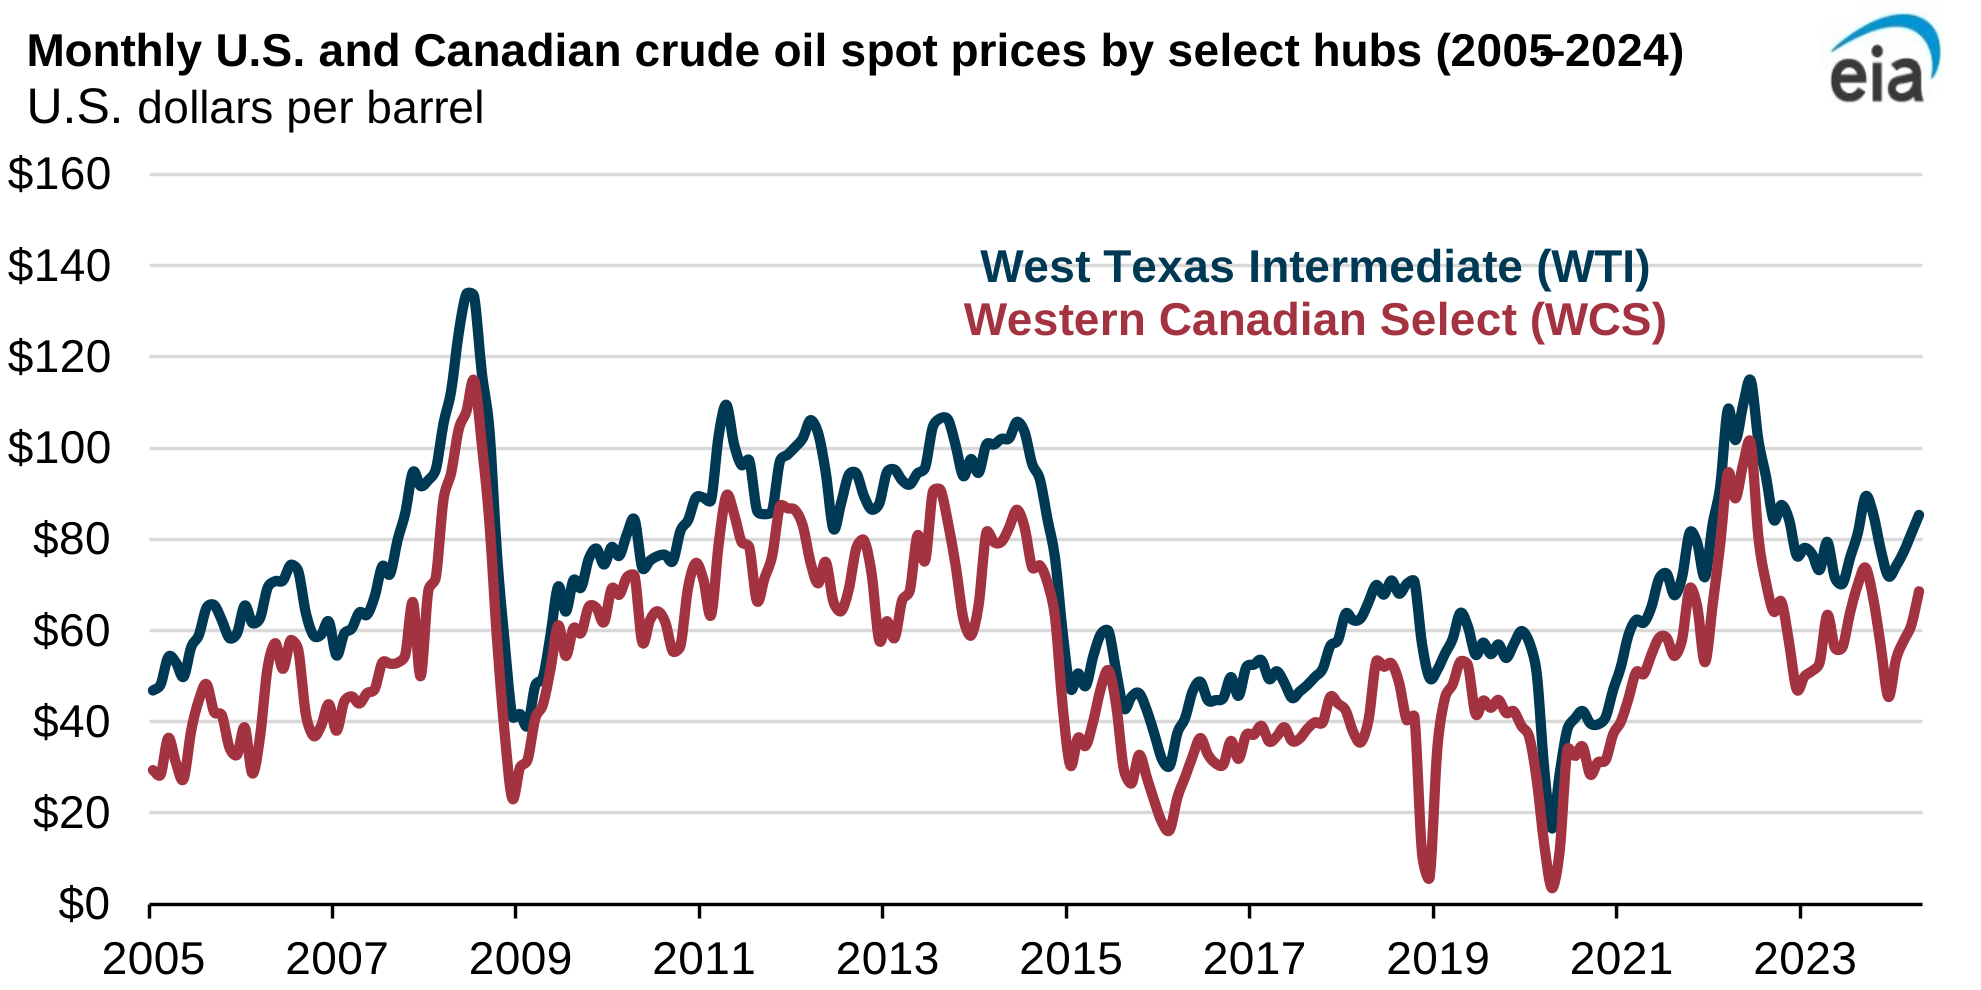
Note: Data are through April 2024.
The price per barrel of Western Canadian Select crude oil (WCS) is typically lower than the U.S. benchmark West Texas Intermediate (WTI). This difference is partly because WCS is a heavier blend, requiring more processing and advanced refinery units with higher operating costs to refine it. Heavy crude oils require more refining and processing to produce valuable end products such as gasoline and diesel. As a result, refineries have to invest more in processing equipment to make WCS usable, which lowers its market value.
Canada’s crude oil production has outpaced the growth in pipeline capacity to markets outside of Canada. As a result, the price of WCS has remained at a significant discount to WTI. Canada’s oil producers have used rail transportation—a more expensive mode of oil transport than pipelines—to deliver crude oil to the United States, also requiring a larger price discount for U.S. refiners of WCS crude oil to remain economical. In addition, Western Canada has had difficulties accessing global markets due to limited pipeline infrastructure connecting the region to coastal ports. This challenge has resulted in oversupply, saturating the local market and reducing prices for WCS.
Principal contributor: Matias Arnal