
Renewable utility-scale electricity production differs by fuel among states
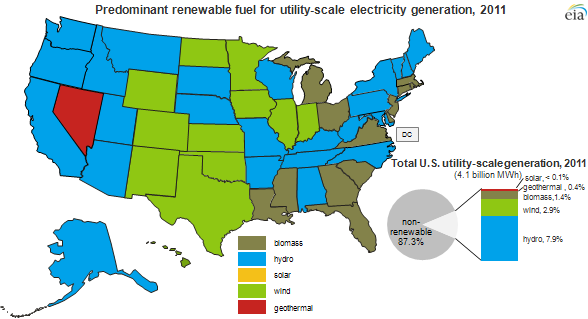
Generation of electricity from renewable sources has increased over the last decade, from 8% of total generation in the electric power sector in 2001 to 13% in 2011. However, there are significant differences among states in the type and amount of renewable energy used, due to variation in the level of development and the availability of renewable resources. The first two maps below identify the fuel type producing the most generation for each state, with and without hydroelectric (hydro) generation. The other maps take a fuel-by-fuel look at the level of renewable generation.
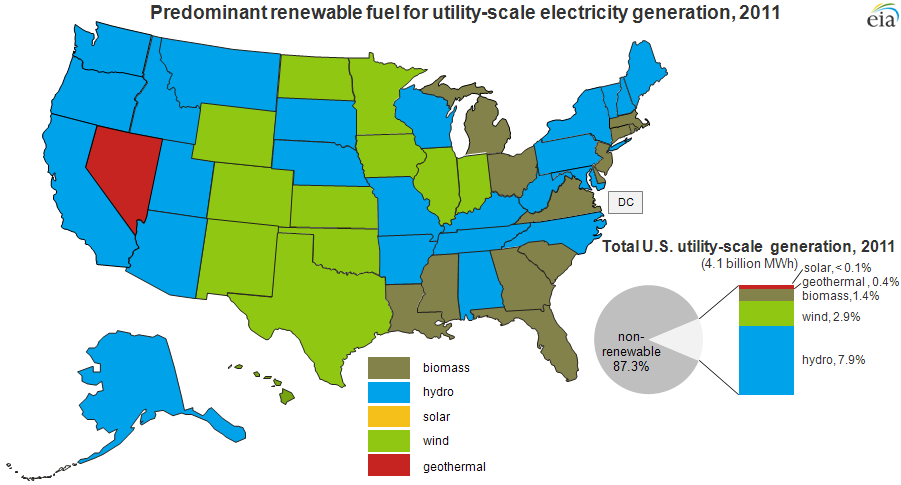
Notes: 2011 data are currently preliminary and are subject to change upon publication of final data. Final data will include state-level detail on solar generation in the electric power sector for all 50 states. No state has solar as its predominant renewable fuel at the utility scale. Conventional hydroelectric (hydro) does not include pumped storage. Washington, DC has no utility-scale renewable generation.
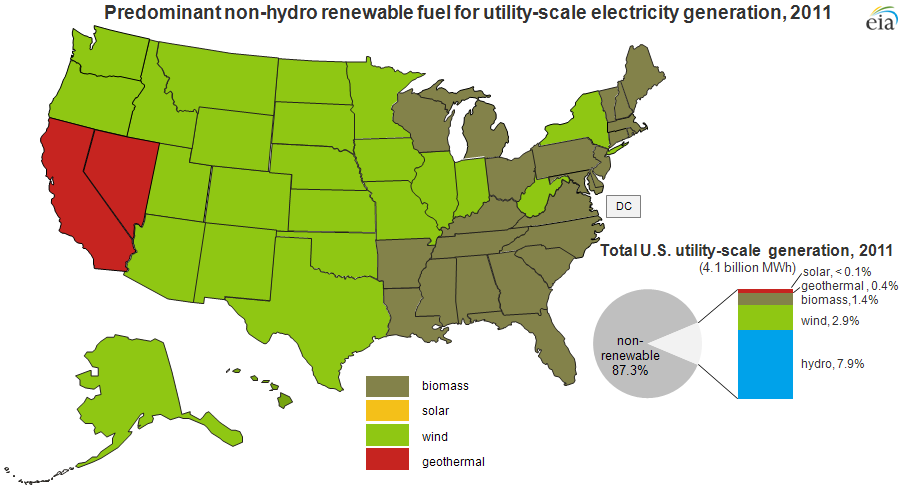
Notes: 2011 data are currently preliminary and are subject to change upon publication of final data. Final data will include state-level detail on solar generation in the electric power sector for all 50 states. No state has solar as its predominant renewable fuel at the utility scale. Washington, DC has no utility-scale renewable generation.
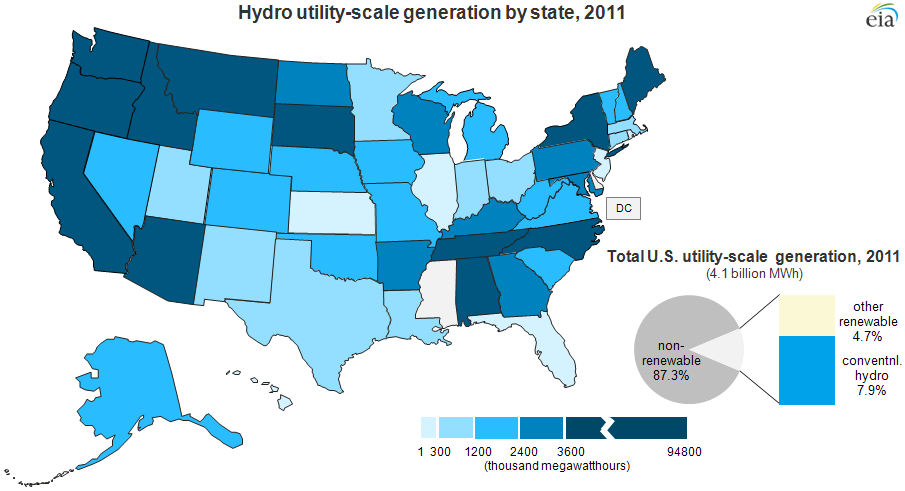
Notes: 2011 data are currently preliminary and are subject to change upon publication of final data. Conventional hydroelectric (hydro) does not include pumped storage.
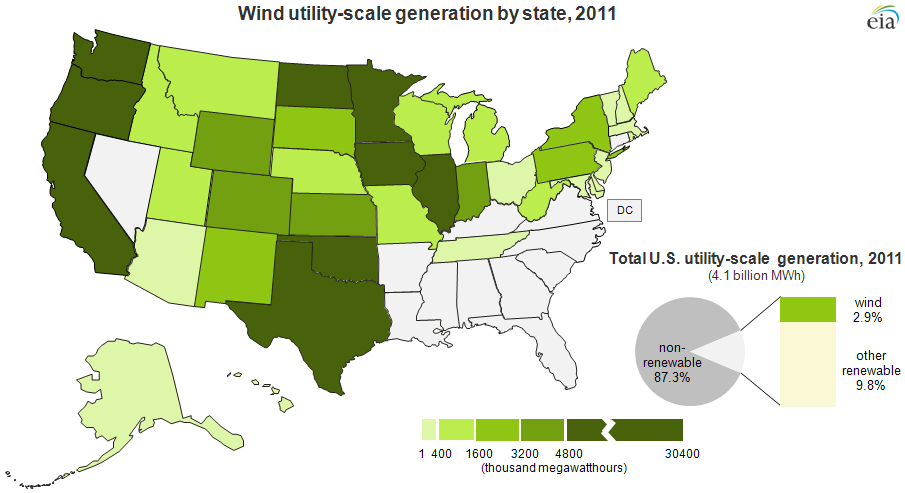
Note: 2011 data are currently preliminary and are subject to change upon publication of final data.
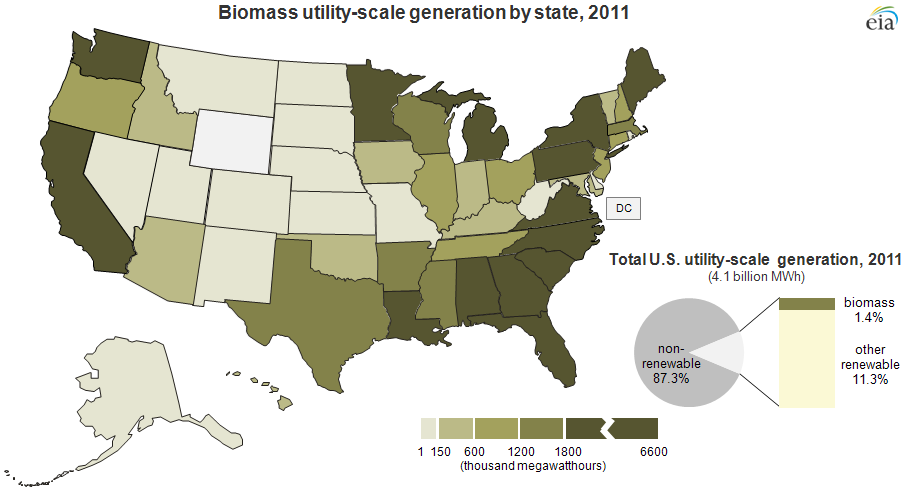
Note: 2011 data are currently preliminary and are subject to change upon publication of final data.
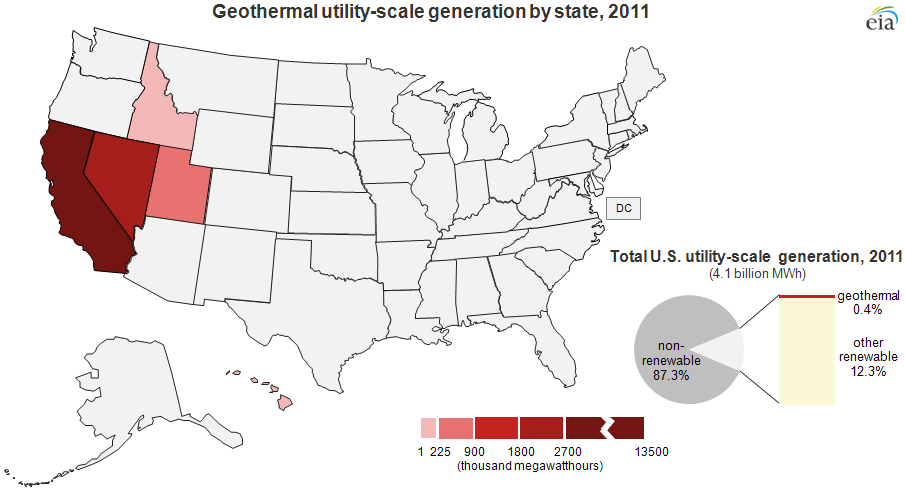
Note: 2011 data are currently preliminary and are subject to change upon publication of final data.
The contribution of renewables to total generation in the electric power sector varies widely at the state level. For non-hydro renewables, the 2011 generation share ranges from less than 1% in Alaska, Ohio, Alabama, and Kentucky, to 27% in Maine. However, when including hydro, the renewable share of electricity generation can rise considerably. In 2011, Idaho, Washington, and Oregon produced 93%, 82%, and 78%, respectively, of in-state generation from renewables.
On the maps of generation by fuel type, please note that the colored scales are different for each fuel. These data include generation from power plants greater than one megawatt in capacity (utility-scale plants), which excludes most distributed generation. While solar is an important component of distributed generation, state-level solar estimates for the utility-scale generation presented here are not yet available for all 50 states. Available 2011 estimates for solar generation are presented in the February issue of the Electric Power Monthly, Table 1.20.B.
An earlier Today in Energy article presented this data on renewable generation by fuel type at the state level in a single graph instead of as separate maps.
Tags: biomass, electricity, generation, geothermal, hydroelectric, map, Oregon, renewables, solar, Washington, wind