
U.S. ammonia prices rise in response to higher international natural gas prices
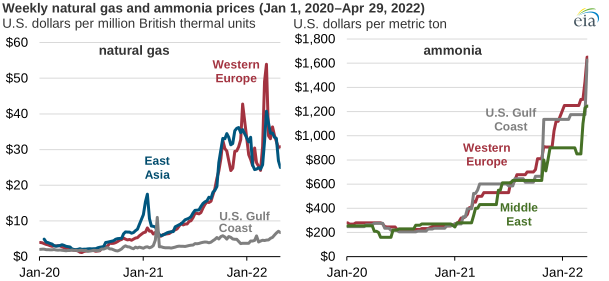
The U.S. price of ammonia, the primary source of nitrogen fertilizer, has risen by a factor of six in the past two years, and most of these increases have occurred since March 2021. Ammonia prices generally follow natural gas prices because ammonia is produced primarily from natural gas. U.S. ammonia prices closely follow international ammonia prices because approximately 14% of total U.S. ammonia consumption is met by imports. Generally, prices of commodity chemicals (ammonia) closely correlate with prices of feedstock (natural gas). Because the global ammonia market is highly interconnected, the U.S. price of ammonia closely follows international ammonia prices rather than only U.S. natural gas prices. Compared with natural gas prices in the United States, which have remained relatively steady, international natural gas prices have risen rapidly over the past 12 months, pulling ammonia prices higher.
Nitrogen-based fertilizer is essential for producing major crops such as corn and wheat. In the United States, nitrogen-based fertilizer is used for nearly all corn acreage to increase yields.
After the 2020–21 winter heating season (November–March), international natural gas prices rose sharply, but the U.S. Henry Hub benchmark traded in a relatively narrow band, between $2.50 per million British thermal units (MMBtu) and $4.00/MMBtu, through September 2021. During this time, the price of natural gas in Western Europe (as reported at the Title Transfer Facility [TTF] in the Netherlands) and in Northeast Asia gradually rose from approximately $6.00/MMBtu in early March 2021 to approximately $18.00/MMBtu in early September 2021.
Prices of natural gas in Western Europe and Northeast Asia continued to rise during the 2021–22 heating season, and they averaged approximately $35.00/MMBtu in the last week of March. Although U.S. natural gas prices also rose, they ended the 2021–22 heating season at close to $5.00/MMBtu, compared with approximately $2.60/MMBtu in March 2021.
The United States Geological Survey (USGS) estimates that in 2021, the United States produced 17 million metric tons (MMmt) of ammonia, behind China (47 MMmt) and Russia (19 MMmt). U.S. ammonia production has nearly doubled since 2012. Consistently low U.S. natural gas prices have contributed to developing new ammonia production capacity and have resulted in restarting ammonia plants that were closed in the early 2000s during a period of high natural gas prices. Despite these capacity additions, the United States remains an ammonia net importer. Between 2012 and 2021, ammonia imports dropped from 37% of the total U.S. ammonia supply to 14% of the total supply.
Consumed as both a feedstock and a fuel, natural gas is important for producing nitrogen-based fertilizers. As a feedstock, natural gas, which is primarily methane (CH4), is reduced to carbon and hydrogen in a steam methane reformer. The hydrogen is then purified and combined with nitrogen to make ammonia (NH3), the foundation for all nitrogen-based fertilizers. In 2021, nearly 90% of the ammonia consumed in the United States was for fertilizer production.
Principal contributors: Tejasvi Raghuveer, Warren Wilczewski
Tags: prices, international, natural gas, Gulf Coast, China, Europe, Russia