
Coal transported to the U.S. electric power sector declined by 22% in 2020
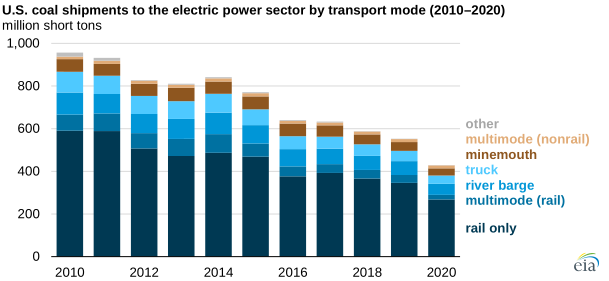
Note: Other includes pipeline, other waterway, Great Lakes barge, tidewater pier, and coastal ports. Multimode rail includes some movement over railways; multimode nonrail uses multiple modes that do not include railway. Data for 2020 are preliminary.
The U.S. electric power sector received 428 million short tons (MMst) of coal in 2020, the lowest annual level for that sector since we began publishing this data in 2007. U.S. coal shipments were down 22% in 2020 from 2019 levels, driven by lower overall electricity demand due to responses to the COVID-19 pandemic and the continued decline in U.S. coal-fired capacity and generation. More than two-thirds (67%) of the coal that was delivered to the U.S. electric power sector in 2020 was shipped either completely or in part by rail; the remainder was shipped by river barge, truck, or other methods.
Plant location—whether the plant is located close to a river, railway, or the supplying coal mine—and the cost-efficiency of the shipping method largely determine the primary way a power plant receives its coal. Although river barge is often the most cost-effective method of transporting large quantities of coal over long distances, river barges are limited to the relatively few coal-fired power plants located on suitable rivers. Shipping by truck is only cost-effective for short-haul distances, and most coal mines are located far away from power plants and consumers.
Although more expensive on a per-ton basis than trucks or river barge, transporting coal by rail through the extensive U.S. rail network is the most common way to transport coal. Rail shipping is a cost-effective way to move large volumes of coal from the relatively few coal-producing regions in remote areas to coal-fired power plants located near electricity customers. Almost all U.S. coal comes from four regions:
- The Powder River Basin (Wyoming and Montana)
- The Illinois Basin (Illinois, Indiana, and Kentucky)
- Central Appalachia (Kentucky and West Virginia)
- Northern Appalachia (Ohio, Pennsylvania, and West Virginia)
Coal shipments by truck and coal received by minemouth plants (coal-fired power plants built near coal mines) declined less in 2020 than other transportation modes, falling by 18% and 19% from 2019 levels, respectively. Coal shipped by waterways fell 20% from 2019 levels. Rail shipments in all forms, including multimode, decreased the most, at 24%.
We released updated tables of average coal transportation costs by transport mode, year, origin, and destination that show state-to-state routes (for example, Wyoming to Illinois) and coal basin-to-state routes (for example, Northern Appalachia to Maryland). Our updated summary of coal transportation rates through 2020 shows the average real costs per ton of transporting coal from mines to power plants by mode. These costs come from the data plant owners and operators report on our Form EIA-923, Power Plant Operations Report.
More information from our coal and electricity industry surveys is available in the interactive coal data browser and electricity data browser.
Principal contributor: Bonnie West
Tags: transportation, generation, coal, electricity, rail