
California gasoline prices increase following refinery outages and declining inventories
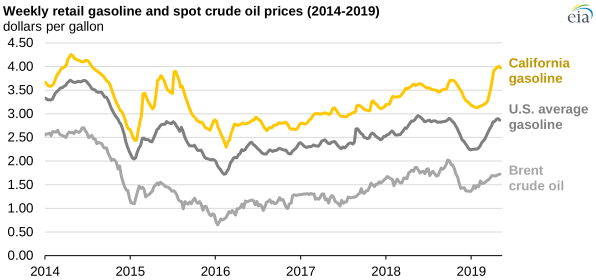
In early May, the California retail gasoline price averaged $4.01 per gallon (gal), surpassing the $4/gal mark for the first time since 2014. By comparison, the U.S. retail gasoline price averaged $2.90/gal. Much of the recent increase in California’s gasoline prices is attributable to refinery outages—both planned and unplanned—and falling gasoline inventories in the region.
Since the beginning of 2019, the price of gasoline in California has increased by $0.75/gal. During the same period, the price of Brent crude oil, the primary driver of U.S. gasoline prices, has only increased by $0.52/gal, implying that other factors specific to California and the West Coast region have contributed to price increases.
Beginning in March 2019, gross refinery inputs in the West Coast (the Petroleum Administration for Defense District (PADD) that includes California) began to rapidly decline. By mid-April, the four-week average of regional refinery runs reached 2.37 million barrels per day (b/d), a rate 9% lower than the previous five-year average. Weekly refinery runs have increased slightly since mid-April, possibly indicating that some refineries in the region are returning to operation.
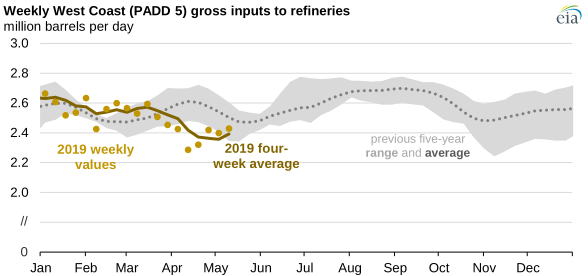
Planned refinery outages typically do not drive large price increases, but unplanned outages can, especially in tightly balanced markets such as the West Coast. According to trade press reports, unplanned outages in the West Coast region include a shutdown in March as a result of emissions issues at a Valero refinery in Benicia, California, and shutdowns in March and in May as a result of two separate fires at a Phillips 66 refinery in Carson, California.
Withdrawals from regional inventories of gasoline are being used to compensate for lower refinery production of gasoline. West Coast gasoline inventories fell to 26.4 million barrels, or 8% lower than the five-year average for the week ending May 10. West Coast gasoline inventories typically decline in the spring, but this year’s decline was greater than normal. As of May 15, 2019, West Coast gasoline inventories were within about 600,000 barrels of their lowest point in the previous five years. Inventories increased by 1.3 million barrels in the following week.
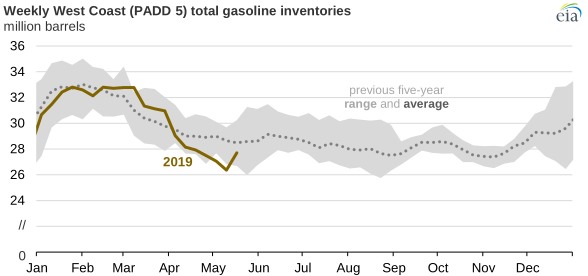
The West Coast is isolated by both geography and a lack of petroleum infrastructure connections to the rest of the United States. In addition, California requires a different gasoline specification than the rest of the country, further narrowing resupply options. These restrictions mean that after drawing down in-region inventories, the next available resupply is through imports from refineries in Asia or Europe.
For the week of May 3, 2019, the four-week rolling average of West Coast imports of total gasoline reached 120,000 b/d, the highest level since EIA began tracking this data in May 2008. This method of resupply is costly, and wholesale prices in the region have increased to cover these associated costs.
Principal contributors: Matt French, Mason Hamilton
Tags: prices, gasoline, Brent, liquid fuels, crude oil, California, inventories/stocks, West Coast, refineries, PADD 5